(Credit: Getty Images )
Algorithm for fish stripes clarifies patterns in nature
A new algorithm could help scientists better understand how zebrafish get their stripes, as well as how other patterns in nature self-assemble.
A new algorithm could help scientists better understand how zebrafish get their stripes, as well as how other patterns in nature self-assemble.
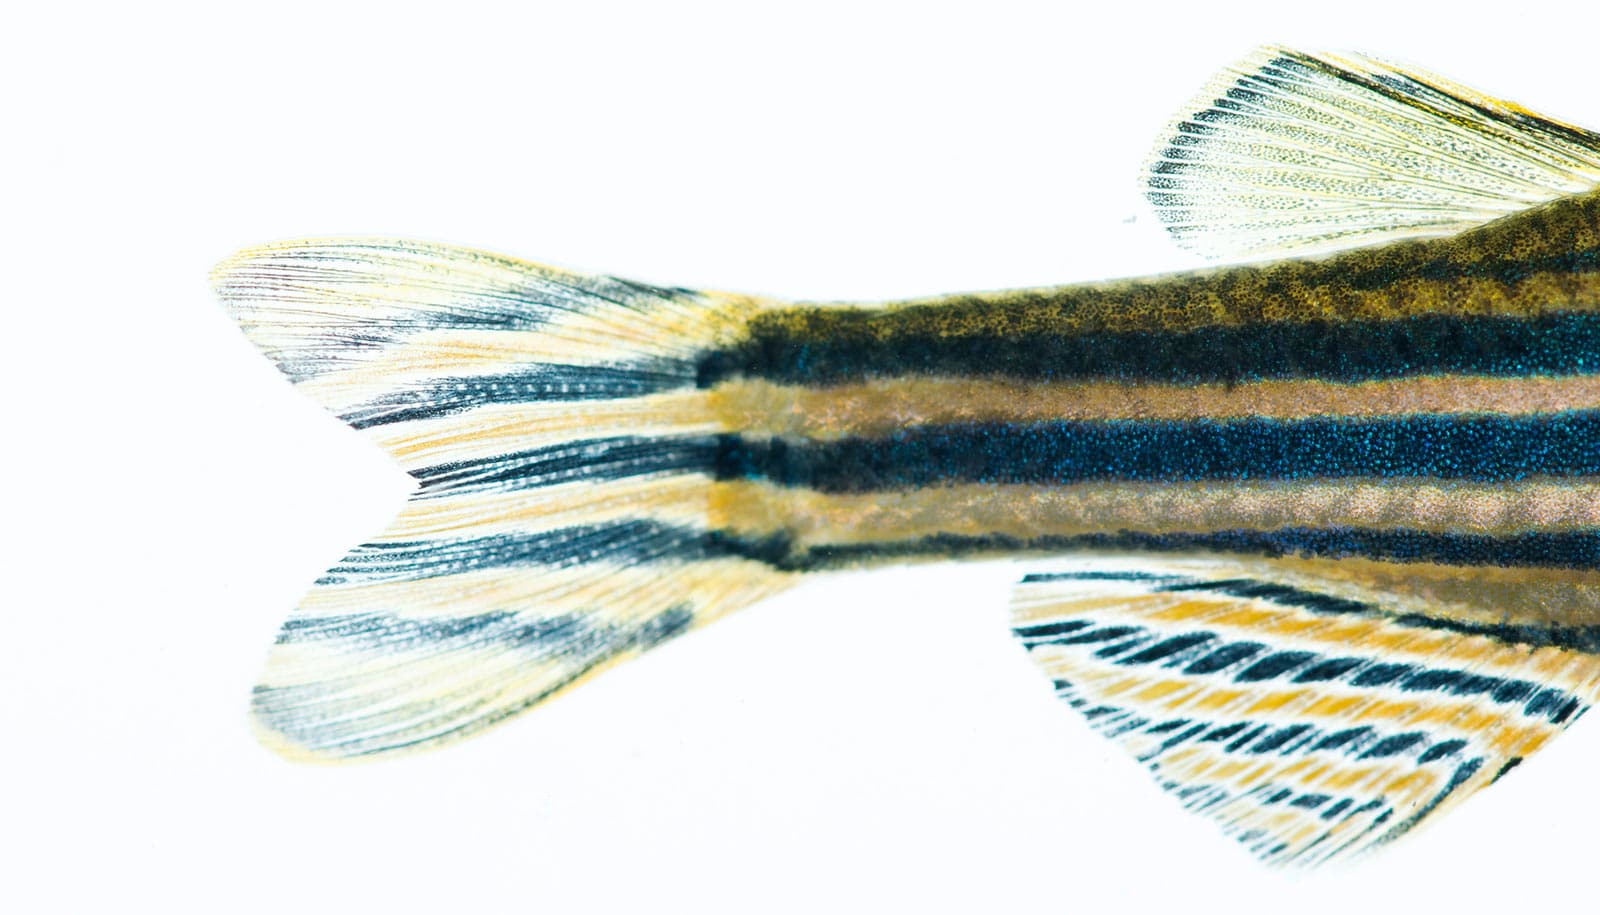
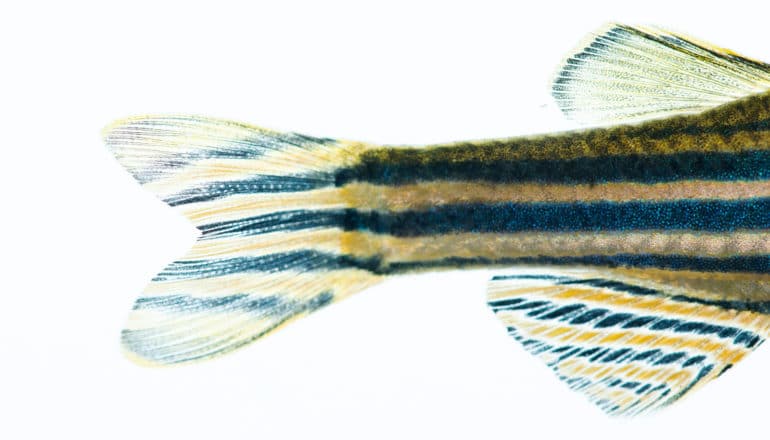
The iconic stripes of zebrafish are a classic example of natural self-organization. As zebrafish embryos develop, three types of pigment cells move around the skin, eventually jostling into positions that form body-length yellow and blue stripes.
Scientists want to understand the genetic rules that direct this delicate dance. The algorithm, which a paper in the Proceedings of the National Academy of Sciences describes, can quantify various attributes of shapes and patterns, enabling scientists to more objectively test ideas about how zebrafish stripes—and potentially other developmental patterns—form.
“This is a newer area of math and statistics that focuses on quantifying shape.”
“The overarching goal of studying zebrafish stripes is to understand the early development of organisms—how genes express themselves to form structures and phenotypes,” says Bjorn Sandstede, a professor in Brown University’s Division of Applied Mathematics and senior author of the research. “People have developed simulations to help understand these processes, but a challenge is that you’re looking at a few zebrafish or a few images from simulations, and you’re essentially eyeballing what the similarities and differences are. We wanted to create something that was automated and more objective.”
Zebrafish turn out to be great testbeds for evaluating how genetic changes can influence pattern formation. Their embryos are transparent and develop quickly, which gives scientists the opportunity to study stripe development in great detail. Over the years, researchers have found a number of genetic mutations that alter zebrafish pigment patterns. Some mutations change the straightness of stripes fish have, some introduce little breaks in the stripes, and others create an array of spots rather than stripes. These mutations provide an opportunity to better understand the rules governing stripe formation.
These differing patterns are the result of changes in the way pigment cell types interact with each other and move around during development. To understand the rules these cells follow, scientists have developed computer models that simulate cellular movement pattern formation. By tweaking the rules governing simulation and then seeing if the output matches the patterns of real fish, scientists can start to figure out what rules matter.
Sandstede and Alexandria Volkening, who earned her PhD at Brown and is now a postdoctoral researcher at Northwestern University, previously developed just such a simulation, and it has yielded new insights on stripe formation. But the new algorithm described in this latest paper, on which Volkening is a coauthor, provides a new way to evaluate the performance of that model and others, the researchers say.
The new algorithm employs a technique known as topological data analysis.
“This is a newer area of math and statistics that focuses on quantifying shape,” says Melissa McGuirl, a graduate student at Brown and the study’s lead author. “Essentially, it’s a tool that allows us to track connected components and loops which correspond to shape features representing spots or stripes.”
In this case, those connected components are made up of individual pigment cells in images of zebrafish or from simulations of zebrafish stripe development. The algorithm evaluates the extent to which the position of each cell is correlated with others, and thus whether the cells are part of a pattern element—a stripe, a spot, or something else. The beauty of the technique, the researchers say, is it can quantify patterns on a broad spectrum of spatial scales, from scale of just a few individual cells to whole fish.
“What we can do with this is determine a variety of descriptors that allow us to talk about things like how straight or curvy the stripes are, how many breaks there are in the stripes or what average cell-to-cell distances are,” Sandstede says. “If there are spots, how many cells are included in each spot? Are they round or more elongated?”
With these more objective feature measures in hand, the researchers can better evaluate how well their model and others are capturing the dynamics of zebrafish pattern formation. And that, the researchers say, could lead to key insights about how genetic instructions manifest themselves in natural structures.
And the technique isn’t just limited to zebrafish, Sandstede says. “It’s much more general than just zebrafish pigment cells,” he says. “This is designed to quantify patterns and shapes, and it could really do that in any kind of system.”
The National Science Foundation and the Simon Foundation supported the work.
Source: Brown University
The post Algorithm for fish stripes clarifies patterns in nature appeared first on Futurity.
Share this article:
This article uses material from the Futurity article, and is licenced under a CC BY-SA 4.0 International License. Images, videos and audio are available under their respective licenses.
Related Articles:

Algorithm takes the grunt work out of quilting
June 4, 2021 • futurity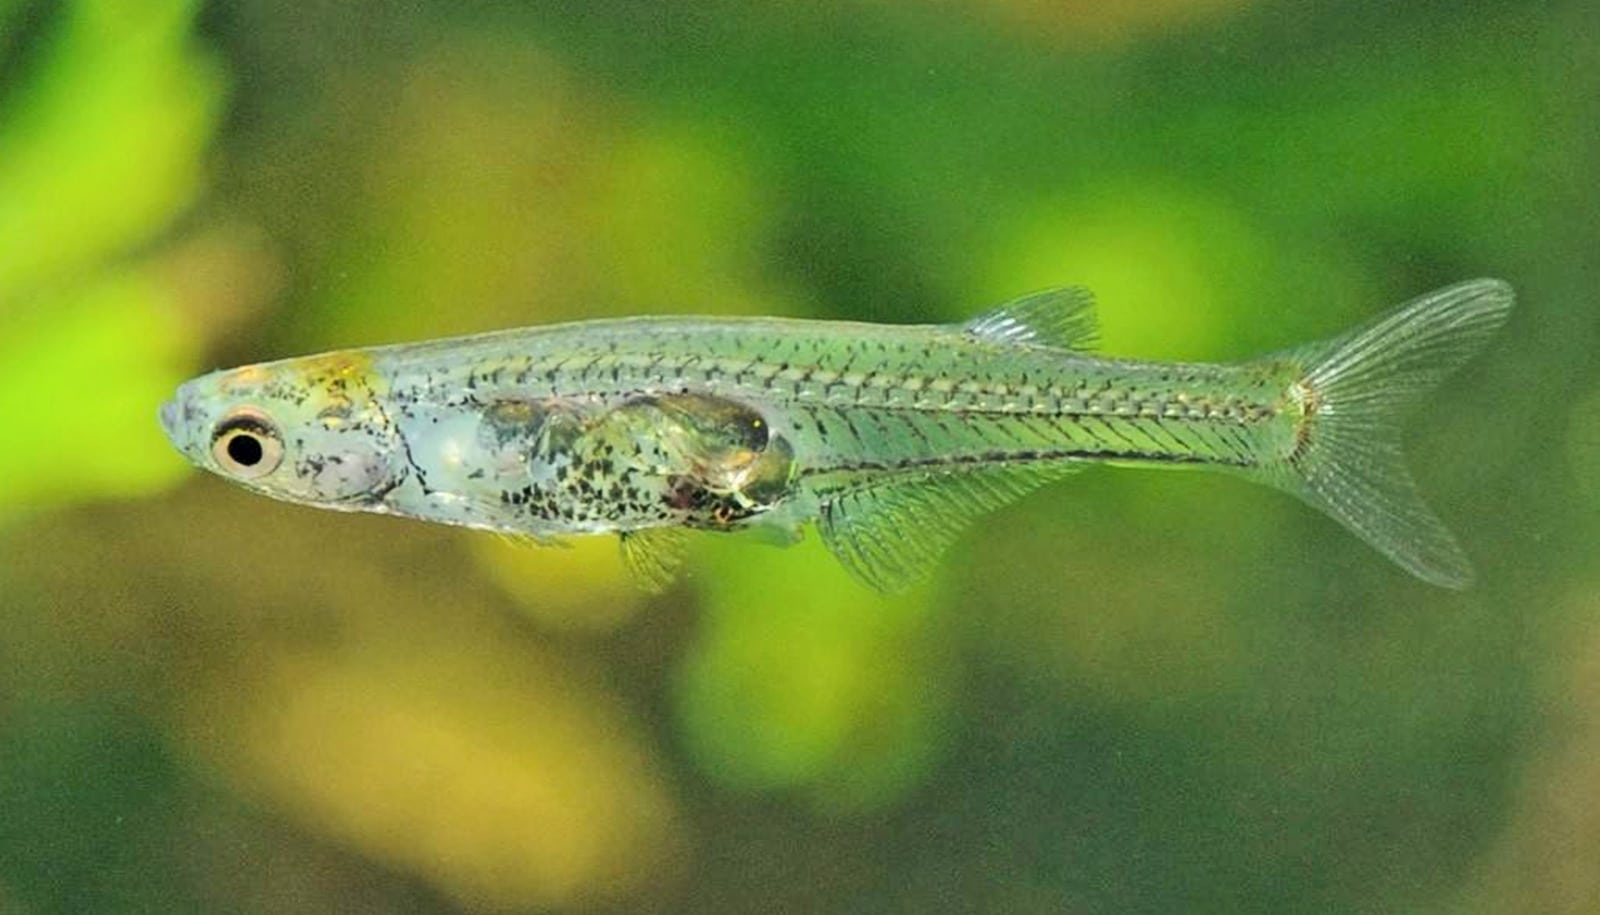
Translucent, fingernail-sized fish is a brand new species
Oct. 1, 2021 • futurityLinks/images:
- https://doi.org/10.1073/pnas.1917763117
- https://www.futurity.org/turing-patterns-coffee-farms-ants-2232512-2/
- https://www.futurity.org/butterfly-wings-crispr-color-patterns-1548742-2/
- https://www.brown.edu/news/2020-02-27/zebrafish
- https://www.futurity.org/zebrafish-stripes-algorithm-2294912-2/
- https://www.futurity.org