(Credit: Robert Baker/Unsplash )
Where is ocean biodiversity most at risk?
New research takes new info into account to create a map of global ocean biodiversity risks and how they correspond to protected areas.

New research provides an overview of where ocean biodiversity is most at risk, and how that compares with protected areas.
The results present the first comprehensive map of risks to biodiversity in the ocean.
Roughly 1 million plant and animal species face extinction, according to a multinational study by a United Nations-backed panel. But where are these species concentrated, and which regions are most vulnerable?
“The idea was to look at the measure of extinction risk at an ecosystem level, and see how it varies across the globe, across all the oceans,” says Casey O’Hara, a doctoral student at the Bren School of Environmental Science & Management at the University of California, Santa Barbara. “And then we asked, ‘How does that compare to where we put marine protections?'”
The global biodiversity picture
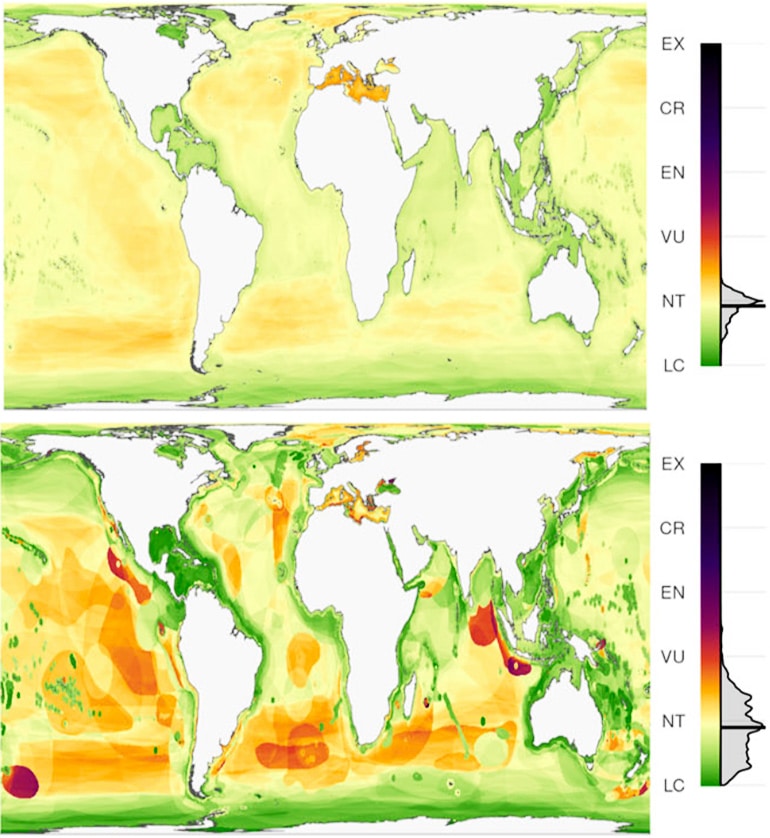
O’Hara and his colleagues combined range and extinction risk data for 5,291 marine species on the Red List of Threatened Species, which the International Union for Conservation of Nature (IUCN) curates, to map the average conservation status of marine biodiversity. The IUCN systematically assesses species and classifies their risk of extinction as “least concern,” “near threatened,” or “threatened.” The last category includes “vulnerable,” “endangered,” and “critically endangered.”
The team averaged the conservation status of all the species they looked at in an area and sorted their results by region, country, habitat type, and taxonomic group. They also did this while weighting the averages by species’ ranges, which emphasized the status of those rare and endemic.
In 83 percent of the ocean, at least a quarter of the species are threatened.
“Basically, I was trying to collect as much information as I could, from as many different species as I could, to map out the global state of marine biodiversity,” O’Hara says.
He found that barely 0.1 percent of the ocean was truly at least concern for extinction. In 83 percent of the ocean, at least a quarter of the species are threatened. Regions like the Mediterranean and Black seas showed the highest risks to biodiversity, the study reports.
When the team compared risks between protected and unprotected areas, they found that, on a global scale, protected areas show similar levels of risk to what’s found in unprotected areas. However, subtleties emerged when the researchers broke these results down into different regions of the oceans.
The difference between risks in protected and unprotected regions is particularly stark on the high seas. On average, high seas ecosystems are near threatened, but protection covers mostly healthy areas of the Southern Ocean, O’Hara explains.
“It’s a lot less politically and economically costly to protect areas that are far away from human activity,” he says. “So if you see something like this there’s a risk that these are merely paper parks, where you’re not really protecting an area from human activity because nobody’s using it.”
It’s hard to tell from the results whether something is a paper park or not, “but the study could give you an idea about where to dig a little bit more to find out,” he adds.
Asia and North America have lots of protection in highly impacted areas. This may present an opportunity for countries in these regions to maintain the health of less degraded areas at fairly low cost. “You’re less likely to be taking those areas out of active use, so it just might indicate some opportunities for proactive protection,” O’Hara says.
Two conservation strategies
The results highlight two major strategies when it comes to conservation: proactive and reactive protection. The former aims to preserve healthy systems, while the latter is meant to allow degraded systems to heal. Both serve important roles by filling different conservation needs.
O’Hara and his advisor, Ben Halpern, a professor at the Bren School and director of the National Center for Ecological Analysis and Synthesis, are currently working on a study comparing where species are threatened to the distribution of human impacts. This follows up on two reports Halpern released in 2008 and 2015. The new research will draw on O’Hara’s results and look at correlations on a species-by-species basis.
For instance, if conservationists know a certain fish faces risks from bottom trawling, the new study might look where in the ocean this species exists and compare that to where bottom trawling occurs. “This way we can get a finer resolution of where the threats are happening and where the species that are threatened by those occur,” O’Hara says. Once you find the overlap you see the risks.
These studies help identify places where conservation efforts can have a big impact, and O’Hara hopes they inform the Post-2020 Global Biodiversity Framework, an international agreement set to be negotiated next year.
“Biodiversity is actually a complicated collection of ideas,” O’Hara says. “The metrics we usually use don’t take into account conservation status. So what we’re doing is adding the IUCN conservation status into the mix, which provides an additional filter for looking at biodiversity.”
The research appears in Conservation Letters.
Source: UC Santa Barbara
The post Where is ocean biodiversity most at risk? appeared first on Futurity.
Share this article:
This article uses material from the Futurity article, and is licenced under a CC BY-SA 4.0 International License. Images, videos and audio are available under their respective licenses.
Related Articles:
When corals go extinct, it hurts the survivors
Feb. 6, 2019 • futurity