1994_Sheffield_City_Council_election
Elections to Sheffield City Council were held on 5 May 1994. One third of the council was up for election. Since the previous election, three by-elections had taken place, resulting in two Lib Dem gains from Labour in Brightside and Walkley and a successful hold of a Dore seat by the Conservatives.[1] This, along with a defection from Burngreave councillor James Jamison, left Labour down three, the Liberal Democrats up two and the Conservatives unchanged going into this election.
Quick Facts 32 of 87 seats to Sheffield City Council 44 seats needed for a majority, First party ...
| |||||||||||||||||||||
32 of 87 seats to Sheffield City Council 44 seats needed for a majority | |||||||||||||||||||||
|---|---|---|---|---|---|---|---|---|---|---|---|---|---|---|---|---|---|---|---|---|---|
| |||||||||||||||||||||
Map showing the results of the 1994 Sheffield City Council elections. | |||||||||||||||||||||
| |||||||||||||||||||||
Close
More information Party, Seats ...
| Party | Seats | Gains | Losses | Net gain/loss | Seats % | Votes % | Votes | +/− | |
|---|---|---|---|---|---|---|---|---|---|
| Liberal Democrats | 12 | 11 | 0 | +11 | 37.5 | 42.1 | 64,208 | +14.4 | |
| Labour | 20 | 0 | 8 | -8 | 62.5 | 41.2 | 62,741 | +3.0 | |
| Conservative | 0 | 0 | 3 | -3 | 0.0 | 13.3 | 20,291 | -19.1 | |
| Green | 0 | 0 | 0 | 0 | 0.0 | 1.2 | 1,903 | -0.3 | |
| Save Our Park and Services | 0 | 0 | 0 | 0 | 0.0 | 1.1 | 1,613 | N/A | |
| Militant Labour | 0 | 0 | 0 | 0 | 0.0 | 0.4 | 682 | +0.3 | |
| Independent | 0 | 0 | 0 | 0 | 0.0 | 0.3 | 505 | N/A | |
| Independent Labour | 0 | 0 | 0 | 0 | 0.0 | 0.3 | 385 | N/A | |
| Communist League | 0 | 0 | 0 | 0 | 0.0 | 0.0 | 35 | N/A | |
Close
This result had the following consequences for the total number of seats on the council after the elections:
More information Party, Previous council ...
| Party | Previous council | New council | |||
|---|---|---|---|---|---|
| Labour | 64 | 56 | |||
| Liberal Democrats | 11 | 22 | |||
| Conservatives | 11 | 8 | |||
| Independent Labour | 1 | 1 | |||
| Total | 87 | 87 | |||
| Working majority | 41 | 25 | |||
Close
More information Party, Candidate ...
| Party | Candidate | Votes | % | ±% | |
|---|---|---|---|---|---|
| Liberal Democrats | Peter Moore* | 4,652 | 64.5 | +7.7 | |
| Labour | Barry Birks | 1,577 | 21.9 | +4.9 | |
| Conservative | Michael Young | 859 | 11.9 | -14.2 | |
| Save Our Park and Services | Violet Needham | 120 | 1.6 | +1.6 | |
| Majority | 3,075 | 42.6 | +11.9 | ||
| Turnout | 7,208 | 49.3 | +3.5 | ||
| Liberal Democrats hold | Swing | +1.4 | |||
Close
More information Party, Candidate ...
| Party | Candidate | Votes | % | ±% | |
|---|---|---|---|---|---|
| Labour | Donald Gow* | 3,039 | 55.1 | +7.0 | |
| Liberal Democrats | Louise Truman | 1,724 | 31.3 | +14.4 | |
| Conservative | Margaret Pigott | 749 | 13.6 | -21.3 | |
| Majority | 1,315 | 23.8 | +10.6 | ||
| Turnout | 5,512 | 36.1 | +9.6 | ||
| Labour hold | Swing | -3.7 | |||
Close
More information Party, Candidate ...
| Party | Candidate | Votes | % | ±% | |
|---|---|---|---|---|---|
| Labour | Alfred Meade** | 2,076 | 47.6 | -7.6 | |
| Liberal Democrats | Joyce Brodie | 1,986 | 45.5 | +29.1 | |
| Conservative | Michael Quirke | 210 | 4.8 | -23.6 | |
| Save Our Park and Services | Alan Shipley | 90 | 2.0 | +2.0 | |
| Majority | 90 | 2.1 | -24.7 | ||
| Turnout | 4,362 | 33.7 | +14.5 | ||
| Labour hold | Swing | -18.3 | |||
Close
Alfred Meade was a sitting councillor for Stocksbridge ward
More information Party, Candidate ...
| Party | Candidate | Votes | % | ±% | |
|---|---|---|---|---|---|
| Labour | Richard Eastall* | 2,179 | 38.4 | +5.4 | |
| Liberal Democrats | Leonard Hesketh | 1,809 | 31.9 | +14.9 | |
| Conservative | Charles Wallis | 1,372 | 24.2 | -18.5 | |
| Green | Joseph Otten | 191 | 3.4 | -3.7 | |
| Save Our Park and Services | Lorette Bilby | 120 | 2.1 | +2.1 | |
| Majority | 370 | 6.5 | -3.2 | ||
| Turnout | 5,671 | 34.6 | +4.1 | ||
| Labour hold | Swing | -4.7 | |||
Close
More information Party, Candidate ...
| Party | Candidate | Votes | % | ±% | |
|---|---|---|---|---|---|
| Labour | John Watson* | 1,986 | 61.1 | +0.9 | |
| Liberal Democrats | Katherine Milson | 630 | 19.4 | +1.5 | |
| Independent | Donald Sparkes | 345 | 10.6 | +10.6 | |
| Conservative | David Knight | 251 | 7.7 | -14.1 | |
| Communist League | Antony Hunt | 35 | 1.1 | +1.1 | |
| Majority | 1,356 | 41.7 | +3.3 | ||
| Turnout | 3,247 | 27.9 | +7.3 | ||
| Labour hold | Swing | -0.3 | |||
Close
More information Party, Candidate ...
| Party | Candidate | Votes | % | ±% | |
|---|---|---|---|---|---|
| Labour | Peter Horton* | 1,963 | 67.0 | +3.5 | |
| Liberal Democrats | Andrew McKerrow | 567 | 19.3 | +3.8 | |
| Conservative | Anne Smith | 270 | 9.2 | -11.8 | |
| Green | Graham Wroe | 130 | 4.4 | +4.4 | |
| Majority | 1,396 | 47.7 | +5.2 | ||
| Turnout | 2,930 | 25.4 | +6.2 | ||
| Labour hold | Swing | -0.1 | |||
Close
More information Party, Candidate ...
| Party | Candidate | Votes | % | ±% | |
|---|---|---|---|---|---|
| Liberal Democrats | Francis Butler | 4,529 | 61.1 | +0.2 | |
| Labour | Laurence Kingham* | 2,489 | 33.6 | +7.0 | |
| Conservative | Michael Boot | 393 | 5.3 | -7.2 | |
| Majority | 2,040 | 27.5 | -6.8 | ||
| Turnout | 7,411 | 40.4 | +7.3 | ||
| Liberal Democrats gain from Labour | Swing | -3.4 | |||
Close
More information Party, Candidate ...
| Party | Candidate | Votes | % | ±% | |
|---|---|---|---|---|---|
| Labour | Choudry Walayat* | 2,110 | 47.1 | -4.3 | |
| Liberal Democrats | Theresa Hainey | 1,448 | 32.3 | +20.6 | |
| Conservative | Laurence Hayward | 571 | 12.7 | -16.9 | |
| Green | Gordon Ferguson | 348 | 7.8 | +0.5 | |
| Majority | 662 | 14.8 | -7.0 | ||
| Turnout | 4,477 | 30.3 | +8.2 | ||
| Labour hold | Swing | -12.4 | |||
Close
More information Party, Candidate ...
| Party | Candidate | Votes | % | ±% | |
|---|---|---|---|---|---|
| Liberal Democrats | Colin Ross | 3,292 | 45.1 | +27.2 | |
| Conservative | John Harthman* | 2,627 | 36.0 | -28.8 | |
| Labour | Michael King | 1,248 | 17.1 | -0.2 | |
| Save Our Park and Services | Joyce Baptie | 124 | 1.7 | +1.7 | |
| Majority | 665 | 9.1 | -37.8 | ||
| Turnout | 7,291 | 45.3 | +6.4 | ||
| Liberal Democrats gain from Conservative | Swing | +28.0 | |||
Close
More information Party, Candidate ...
| Party | Candidate | Votes | % | ±% | |
|---|---|---|---|---|---|
| Liberal Democrats | Roger Davison | 3,022 | 42.2 | +20.4 | |
| Conservative | Stuart Dawson* | 2,433 | 33.9 | -26.0 | |
| Labour | Lawrence Samuels | 1,334 | 18.6 | +2.8 | |
| Save Our Park and Services | Philip Eastwood | 375 | 5.2 | +5.2 | |
| Majority | 589 | 8.3 | -29.8 | ||
| Turnout | 7,164 | 45.5 | +6.7 | ||
| Liberal Democrats gain from Conservative | Swing | +23.2 | |||
Close
More information Party, Candidate ...
| Party | Candidate | Votes | % | ±% | |
|---|---|---|---|---|---|
| Labour | Joan Barton* | 2,726 | 65.4 | +2.2 | |
| Labour | Alan Law | 2,300 | |||
| Liberal Democrats | Susan Cutts | 1,090 | 26.1 | +16.5 | |
| Liberal Democrats | Ruth Dawson | 898 | |||
| Conservative | Steven Clark | 354 | 8.5 | -18.6 | |
| Conservative | Fiona Leach | 243 | |||
| Majority | 1,210 | 39.3 | +3.2 | ||
| Turnout | 4,170 | 28.6 | +6.2 | ||
| Labour hold | Swing | ||||
| Labour hold | Swing | -7.1 | |||
Close
More information Party, Candidate ...
| Party | Candidate | Votes | % | ±% | |
|---|---|---|---|---|---|
| Liberal Democrats | Duncan Kime | 3,729 | 50.4 | +25.2 | |
| Conservative | Graham Lawson* | 2,350 | 31.7 | -24.6 | |
| Labour | William Barnard | 1,159 | 15.6 | +1.0 | |
| Green | Peter Scott | 162 | 2.2 | -1.6 | |
| Majority | 1,379 | 18.7 | -12.4 | ||
| Turnout | 7,400 | 50.0 | +10.3 | ||
| Liberal Democrats gain from Conservative | Swing | +24.9 | |||
Close
More information Party, Candidate ...
| Party | Candidate | Votes | % | ±% | |
|---|---|---|---|---|---|
| Labour | Raymond Satur | 2,553 | 50.0 | -0.2 | |
| Liberal Democrats | Michael Ogden | 2,050 | 40.1 | +20.4 | |
| Conservative | Shirley Clayton | 501 | 9.8 | -20.2 | |
| Majority | 503 | 9.9 | -10.3 | ||
| Turnout | 5,104 | 35.6 | +10.9 | ||
| Labour hold | Swing | -10.3 | |||
Close
More information Party, Candidate ...
| Party | Candidate | Votes | % | ±% | |
|---|---|---|---|---|---|
| Liberal Democrats | Stephen Ayris | 3,282 | 52.5 | +19.8 | |
| Labour | Roy Darke* | 2,534 | 40.5 | -4.9 | |
| Conservative | Francis Woodger | 297 | 4.7 | -17.2 | |
| Save Our Park and Services | Hilary Pickin | 136 | 2.2 | +2.2 | |
| Majority | 748 | 12.5 | -0.2 | ||
| Turnout | 6,249 | 43.3 | +15.5 | ||
| Liberal Democrats gain from Labour | Swing | +12.3 | |||
Close
More information Party, Candidate ...
| Party | Candidate | Votes | % | ±% | |
|---|---|---|---|---|---|
| Liberal Democrats | Christine Tosseano | 3,179 | 50.8 | +19.8 | |
| Labour | Audrey Hilbert | 2,300 | 36.7 | +1.2 | |
| Conservative | Michael Hayman | 659 | 10.5 | -19.1 | |
| Save Our Park and Services | Avril Critchley | 122 | 1.9 | +1.9 | |
| Majority | 879 | 14.1 | +9.6 | ||
| Turnout | 6,260 | 41.8 | +9.9 | ||
| Liberal Democrats gain from Labour | Swing | +9.3 | |||
Close
More information Party, Candidate ...
| Party | Candidate | Votes | % | ±% | |
|---|---|---|---|---|---|
| Labour | Freda White | 2,449 | 45.4 | +2.4 | |
| Labour | David Lawton | 2,428 | |||
| Liberal Democrats | Christopher Tutt | 2,177 | 40.4 | +22.7 | |
| Liberal Democrats | Robert Watson | 2,039 | |||
| Conservative | Michael Pinder | 595 | 11.0 | -28.3 | |
| Conservative | Jack Thompson | 523 | |||
| Save Our Park and Services | Margaret Stuart | 171 | 3.2 | +3.2 | |
| Majority | 272 | 5.0 | +1.3 | ||
| Turnout | 5,392 | 33.8 | +8.3 | ||
| Labour hold | Swing | -10.1 | |||
Close
More information Party, Candidate ...
| Party | Candidate | Votes | % | ±% | |
|---|---|---|---|---|---|
| Labour | Janet Fiore | 1,880 | 66.7 | +5.2 | |
| Liberal Democrats | Roy Denton | 709 | 25.2 | +8.9 | |
| Conservative | Andrew Watson | 227 | 8.0 | -14.1 | |
| Majority | 1,171 | 41.5 | +2.1 | ||
| Turnout | 2,816 | 30.4 | +9.2 | ||
| Labour hold | Swing | -1.8 | |||
Close
More information Party, Candidate ...
| Party | Candidate | Votes | % | ±% | |
|---|---|---|---|---|---|
| Labour | Ian Saunders* | 4,144 | 52.3 | +6.6 | |
| Liberal Democrats | Alan Hatcher | 2,670 | 33.7 | +18.8 | |
| Conservative | Thomas Pigott | 1,102 | 13.9 | -25.5 | |
| Majority | 1,474 | 18.6 | +12.3 | ||
| Turnout | 7,916 | 31.5 | +8.4 | ||
| Labour hold | Swing | -6.1 | |||
Close
More information Party, Candidate ...
| Party | Candidate | Votes | % | ±% | |
|---|---|---|---|---|---|
| Liberal Democrats | Doreen Huddard | 2,989 | 50.0 | +1.1 | |
| Labour | Qurban Hussain* | 2,090 | 35.0 | +4.7 | |
| Conservative | Marjorie Kirby | 567 | 9.5 | -7.5 | |
| Green | R. Southworth | 229 | 3.8 | +0.1 | |
| Save Our Park and Services | A. Dronfield | 99 | 1.7 | +1.7 | |
| Majority | 899 | 15.1 | -3.5 | ||
| Turnout | 5,974 | 41.3 | +5.8 | ||
| Liberal Democrats gain from Labour | Swing | -1.8 | |||
Close
More information Party, Candidate ...
| Party | Candidate | Votes | % | ±% | |
|---|---|---|---|---|---|
| Labour | Doreen Newton | 2,238 | 56.0 | +4.1 | |
| Liberal Democrats | Wayne Morton | 1,434 | 35.9 | +10.7 | |
| Conservative | E. Platts | 328 | 8.2 | -14.6 | |
| Majority | 804 | 20.1 | -6.6 | ||
| Turnout | 4,000 | 31.7 | +8.8 | ||
| Labour hold | Swing | -3.3 | |||
Close
More information Party, Candidate ...
| Party | Candidate | Votes | % | ±% | |
|---|---|---|---|---|---|
| Labour | Michael Bower* | 1,849 | 38.2 | -12.2 | |
| Liberal Democrats | Sylvia Anginotti | 1,624 | 33.5 | +16.7 | |
| Liberal Democrats | Howard Middleton | 1,561 | |||
| Labour | Michael Smith | 1,455 | |||
| Green | Barry New | 477 | 9.9 | -0.7 | |
| Independent Labour | P. Wallace | 385 | 8.0 | +8.0 | |
| Conservative | Maureen Neill | 265 | 5.5 | -16.6 | |
| Save Our Park and Services | J. Green | 156 | 3.2 | +3.2 | |
| Independent Labour | P. Hughes | 139 | |||
| Independent | R. Clare | 86 | 1.8 | +1.8 | |
| Majority | 225 | 4.7 | -23.6 | ||
| Turnout | 4,842 | 31.8 | +10.5 | ||
| Labour hold | Swing | ||||
| Liberal Democrats gain from Labour | Swing | +14.4 | |||
Close
More information Party, Candidate ...
| Party | Candidate | Votes | % | ±% | |
|---|---|---|---|---|---|
| Labour | James Moore* | 2,333 | 46.6 | +6.0 | |
| Liberal Democrats | B. Noonan | 1,954 | 39.0 | +12.5 | |
| Conservative | Michael Ginn | 723 | 14.4 | -18.4 | |
| Majority | 379 | 7.6 | -0.2 | ||
| Turnout | 5,010 | 40.2 | +6.2 | ||
| Labour hold | Swing | -3.2 | |||
Close
More information Party, Candidate ...
| Party | Candidate | Votes | % | ±% | |
|---|---|---|---|---|---|
| Labour | George Mathews* | 2,166 | 58.8 | +5.1 | |
| Liberal Democrats | M. Sloane | 1,031 | 28.0 | +12.4 | |
| Conservative | Clive Dearden | 344 | 9.3 | -19.0 | |
| Green | Paul Mitchell | 141 | 3.8 | +1.5 | |
| Majority | 1,135 | 30.8 | +5.4 | ||
| Turnout | 3,682 | 29.4 | +7.5 | ||
| Labour hold | Swing | -3.6 | |||
Close
More information Party, Candidate ...
| Party | Candidate | Votes | % | ±% | |
|---|---|---|---|---|---|
| Labour | Doris Mulhearn* | 1,655 | 50.0 | -11.1 | |
| Liberal Democrats | Sheila Hughes | 706 | 21.3 | +6.7 | |
| Militant Labour | Kenneth Douglas | 682 | 20.6 | +20.6 | |
| Conservative | Paul Anderton | 265 | 8.0 | -16.3 | |
| Majority | 949 | 28.7 | -8.1 | ||
| Turnout | 3,308 | 26.2 | +9.5 | ||
| Labour hold | Swing | -8.9 | |||
Close
More information Party, Candidate ...
| Party | Candidate | Votes | % | ±% | |
|---|---|---|---|---|---|
| Labour | C. McDonald | 2,103 | 55.1 | -0.2 | |
| Liberal Democrats | Andrew White | 1,289 | 33.8 | +13.8 | |
| Conservative | Anne Smith | 252 | 6.6 | -15.4 | |
| Save Our Park and Services | W. Pickin | 100 | 2.6 | +2.6 | |
| Independent | Simon Rawlins | 74 | 1.9 | -0.7 | |
| Majority | 814 | 21.3 | -12.0 | ||
| Turnout | 3,818 | 31.4 | +9.4 | ||
| Labour hold | Swing | -7.0 | |||
Close
More information Party, Candidate ...
| Party | Candidate | Votes | % | ±% | |
|---|---|---|---|---|---|
| Liberal Democrats | Victoria Bowden | 4,645 | 59.8 | +8.3 | |
| Labour | John Webster* | 2,343 | 30.2 | +6.9 | |
| Conservative | Lynn Wilson | 783 | 10.1 | -15.0 | |
| Majority | 2,302 | 29.6 | +3.2 | ||
| Turnout | 7,771 | 42.3 | +7.4 | ||
| Liberal Democrats gain from Labour | Swing | +0.7 | |||
Close
More information Party, Candidate ...
| Party | Candidate | Votes | % | ±% | |
|---|---|---|---|---|---|
| Labour | Patricia Nelson* | 2,182 | 67.4 | +0.1 | |
| Liberal Democrats | Alison MacFarlane | 777 | 24.0 | +10.6 | |
| Conservative | David Marriott | 278 | 8.6 | -10.7 | |
| Majority | 1,405 | 43.4 | -4.6 | ||
| Turnout | 3,237 | 27.7 | +6.7 | ||
| Labour hold | Swing | -5.2 | |||
Close
More information Party, Candidate ...
| Party | Candidate | Votes | % | ±% | |
|---|---|---|---|---|---|
| Liberal Democrats | David Chadwick | 2,283 | 55.0 | +15.7 | |
| Labour | Sylvia Parry | 1,517 | 36.5 | -0.3 | |
| Conservative | I. Marshall | 354 | 8.5 | -15.3 | |
| Majority | 766 | 18.4 | +15.9 | ||
| Turnout | 4,154 | 39.3 | +8.7 | ||
| Liberal Democrats gain from Labour | Swing | +8.0 | |||
Close
More information Party, Candidate ...
| Party | Candidate | Votes | % | ±% | |
|---|---|---|---|---|---|
| Liberal Democrats | Andrew Milton | 2,931 | 49.0 | +27.1 | |
| Labour | James Bamford | 2,519 | 42.1 | -1.8 | |
| Conservative | Veronica Hague | 312 | 5.2 | -24.0 | |
| Green | Nicola Watson | 225 | 3.8 | -1.1 | |
| Majority | 412 | 6.9 | -7.8 | ||
| Turnout | 5,987 | 41.0 | +11.8 | ||
| Liberal Democrats gain from Labour | Swing | +14.4 | |||
Close
- "Sheffield election documents: 1992 by-elections". Retrieved 15 October 2011.
- "Sheffield Local Elections 1973-1995 scans". Retrieved 20 June 2011.
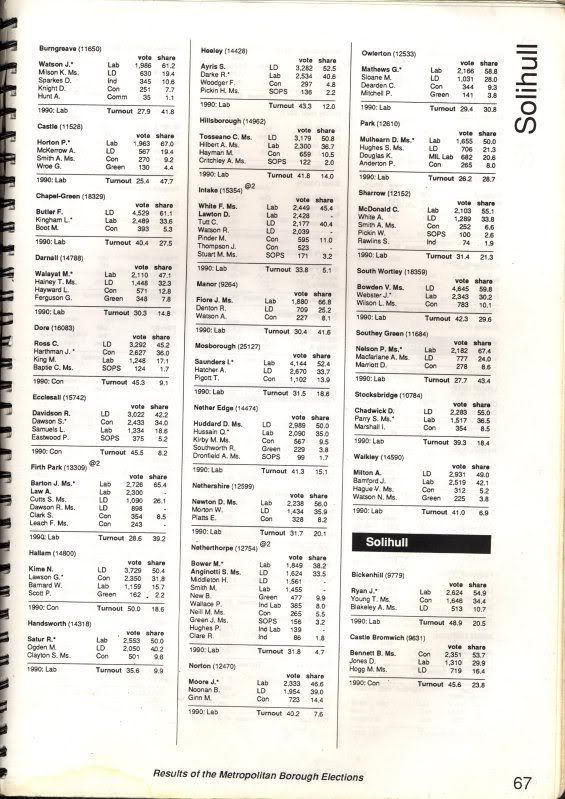
- "Sheffield 1994 results scan". Retrieved 15 October 2011.