Ethnic_groups_in_Belarus
The demographics of Belarus is about the demographic features of the population of Belarus, including population growth, population density, ethnicity, education level, health, economic status, religious affiliations, and other aspects of the population.
| Demographics of Belarus | |
|---|---|
 Population pyramid of Belarus in 2023 | |
| Population | 9,155,978 (2024)[1] |
| Fertility rate | |
| Age structure | |
| 0–14 years | 16.9% (male 821,285/female 772,360) |
| 15–64 years | 67.7% (male 3,053,618/female 3,314,835) |
| 65 and over | 15.4% (male 479,740/female 971,608) (2019 census) |
| Sex ratio | |
| Total | 0.87 male(s)/female (2014) |
| At birth | 1.06 male(s)/female |
| Under 15 | 1.06 male(s)/female |
| 15–64 years | 0.94 male(s)/female |
| 65 and over | 0.46 male(s)/female |
| Nationality | |
| Nationality | noun: Belarusian(s) adjective: Belarusian |
| Major ethnic | Belarusians |
| Language | |
| Spoken | Belarusian, Russian |

| Year | Pop. | ±% p.a. |
|---|---|---|
| 1897 | 6,673,000 | — |
| 1914 | 6,899,100 | +0.20% |
| 1926 | 4,983,240 | −2.67% |
| 1939 | 5,568,994 | +0.86% |
| 1951 | 7,781,100 | +2.83% |
| 1959 | 8,055,700 | +0.43% |
| 1970 | 8,992,200 | +1.00% |
| 1979 | 9,532,500 | +0.65% |
| 1989 | 10,151,800 | +0.63% |
| 1999 | 10,045,200 | −0.11% |
| 2009 | 9,503,800 | −0.55% |
| 2019 | 9,413,446 | −0.10% |
| 2021 | 9,349,645 | −0.34% |
| Source:[2] | ||
The population of Belarus suffered a dramatic decline during World War II, dropping from more than 9 million in 1940 to 7.7 million in 1951. It then resumed its long-term growth, rising to 10 million in 1999.[3] After that the population began a steady decline, dropping to 9.7 million in 2006–2007.[4] Originally a highly agrarian country with nearly 80% of its population in rural areas, Belarus has been undergoing a process of continuous urbanization. The rural population saw its share of the total population decrease from 70% in 1959 to less than 30% in the 2000s.[5]
Graphs are unavailable due to technical issues. There is more info on Phabricator and on MediaWiki.org. |
Graphs are unavailable due to technical issues. There is more info on Phabricator and on MediaWiki.org. |
Graphs are unavailable due to technical issues. There is more info on Phabricator and on MediaWiki.org. |
Population
Age structure
- 0–14 years: 15.4% (male 759,285/female 717,118)
- 15–24 years: 11.7% (male 575,907/female 544,170)
- 25–54 years: 45.5% (male 2,141,419/female 2,227,433)
- 55–64 years: 13.3% (male 562,639/female 716,216)
- 65 years and over: 14.2% (male 430,225/female 933,646) (2014 est.)
Median age
- Total: 39.4 years
- Male: 36.3 years
- Female: 42.4 years (2014 est.)
Sex ratio
- At birth: 1.06 male(s)/female
- 0–14 years: 1.06 male(s)/female
- 15–24 years: 1.06 male(s)/female
- 25–54 years: 0.96 male(s)/female
- 55–64 years: 0.87 male(s)/female
- 65 years and over: 0.46 male(s)/female
- Total population: 0.87 male(s)/female (2014 est.)
 |  |  | ||
| 1970–1989 | 1970–2010 | 1999–2010 |
Life expectancy at birth


.png)
- Total population: 72.15 years
- country comparison to the world: 138
- Male: 66.53 years
- Female: 78.1 years (2014 est.)
| Period | Life expectancy in Years |
|---|---|
| 1950–1955 | 60.71 |
| 1955–1960 | |
| 1960–1965 | |
| 1965–1970 | |
| 1970–1975 | |
| 1975–1980 | |
| 1980–1985 | |
| 1985–1990 | |
| 1990–1995 | |
| 1995–2000 | |
| 2000–2005 | |
| 2005–2010 | |
| 2010–2015 |
Total fertility rate (TFR) in Belarus by region and year
| Region[9] | 2017 | 2016 | 2015 | 2010 | 2005 |
|---|---|---|---|---|---|
| Belarus (total) | 1.54 | 1.73 | 1.72 | 1.49 | 1.25 |
| Minsk | 1.06 | 1.21 | 1.24 | 1.25 | 1.08 |
| Vitebsk Oblast | 1.45 | 1.63 | 1.62 | 1.42 | 1.19 |
| Mogilev Oblast | 1.65 | 1.85 | 1.83 | 1.49 | 1.25 |
| Gomel Oblast | 1.72 | 1.93 | 1.89 | 1.55 | 1.28 |
| Grodno Oblast | 1.75 | 2.03 | 1.96 | 1.63 | 1.30 |
| Brest Oblast | 1.89 | 2.10 | 2.06 | 1.73 | 1.45 |
| Minsk Oblast | 1.94 | 2.16 | 2.18 | 1.72 | 1.37 |
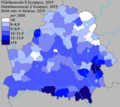 Birth rate (by district, 2019)
 Mortality rate (by district, 2019)
 Rate of natural increase (by district, 2019)


Infant mortality rate
- Total: 4.0
 deaths/1,000 live births for 429 death. (2010)
 - Total: 3.9 deaths/1,000 live births for 422 death. (2011)
- Total: 3.4 deaths/1,000 live births for 386 death. (2012)
- Total: 3.5
 deaths/1,000 live births for 407 death. (2013)
 - Total: 3.5
 deaths/1,000 live births for 415 death. (2014)
- Total: 3.5 deaths/1,000 live births for 321 death. (January–September 2014)
- Total: 3.2
 deaths/1,000 live births for 283 death. (January–September 2015)
Belarusian provinces of the Russian Empire
The figures below refer to the five governorates of the Russian Empire (Grodno, Vitebsk, Minsk, Mogilev, Vilna) with a Belarusian majority.[10]
| Year | Average population (from 1990 onwards beginning of year) | Live births | Deaths | Natural change | Crude birth rate (per 1000) | Crude death rate (per 1000) | Natural change (per 1000) | Crude migration change (per 1000) | Crude population change (per 1000) | Total fertility rate | Abortions reported |
|---|---|---|---|---|---|---|---|---|---|---|---|
| 1950 | 7,745,000 | 197,200 | 62,000 | 135,200 | 25.5 | 8.0 | 17.5 | -14.5 | 2.6 | ||
| 1951 | 7,765,000 | 198,200 | 61,200 | 137,000 | 25.5 | 7.9 | 17.6 | -23.3 | -5.7 | ||
| 1952 | 7,721,000 | 191,100 | 64,200 | 126,900 | 24.8 | 8.3 | 16.4 | -20.4 | -4.0 | ||
| 1953 | 7,690,000 | 176,200 | 61,900 | 114,300 | 22.9 | 8.0 | 14.9 | -10.7 | 4.2 | ||
| 1954 | 7,722,000 | 193,100 | 61,600 | 131,500 | 25.0 | 8.0 | 17.0 | -6.4 | 10.6 | ||
| 1955 | 7,804,000 | 194,400 | 58,000 | 136,400 | 24.9 | 7.4 | 17.5 | -7.8 | 9.7 | ||
| 1956 | 7,880,000 | 199,500 | 56,000 | 143,500 | 25.3 | 7.1 | 18.2 | -11.1 | 7.1 | ||
| 1957 | 7,936,000 | 200,800 | 58,000 | 142,800 | 25.3 | 7.3 | 18.0 | -8.8 | 9.2 | ||
| 1958 | 8,009,000 | 207,700 | 53,700 | 154,000 | 25.9 | 6.7 | 19.2 | -6.3 | 12.9 | ||
| 1959 | 8,112,000 | 204,600 | 62,600 | 142,000 | 25.2 | 7.7 | 17.5 | -7.9 | 9.6 | 2.72 | |
| 1960 | 8,190,000 | 200,218 | 54,037 | 146,181 | 24.4 | 6.6 | 17.8 | -6.3 | 11.5 | 2.69 | 170,787 |
| 1961 | 8,284,000 | 194,239 | 53,682 | 140,557 | 23.4 | 6.5 | 17.0 | -4.8 | 12.2 | 2.66 | 178,290 |
| 1962 | 8,385,000 | 185,302 | 60,676 | 124,626 | 22.1 | 7.2 | 14.9 | -6.3 | 8.7 | 2.57 | 185,554 |
| 1963 | 8,458,000 | 173,889 | 58,291 | 115,598 | 20.6 | 6.9 | 13.7 | -6.5 | 7.2 | 2.46 | 191,137 |
| 1964 | 8,519,000 | 161,794 | 53,967 | 107,827 | 19.0 | 6.3 | 12.7 | -2.4 | 10.3 | 2.36 | 200,534 |
| 1965 | 8,607,000 | 153,865 | 58,156 | 95,709 | 17.9 | 6.8 | 11.1 | 0.8 | 11.9 | 2.27 | 205,999 |
| 1966 | 8,709,000 | 153,414 | 58,265 | 95,149 | 17.6 | 6.7 | 10.9 | -0.5 | 10.4 | 2.28 | 203,430 |
| 1967 | 8,800,000 | 147,501 | 61,263 | 86,238 | 16.8 | 7.0 | 9.8 | -1.1 | 8.8 | 2.26 | 203,722 |
| 1968 | 8,877,000 | 146,095 | 62,354 | 83,741 | 16.5 | 7.0 | 9.4 | -0.4 | 9.0 | 2.23 | 198,955 |
| 1969 | 8,957,000 | 142,652 | 65,912 | 76,740 | 15.9 | 7.4 | 8.6 | 0.4 | 9.0 | 2.18 | 191,637 |
| 1970 | 9,038,000 | 146,676 | 68,974 | 77,702 | 16.2 | 7.6 | 8.6 | -0.4 | 8.2 | 2.30 | 187,935 |
| 1971 | 9,112,000 | 149,135 | 68,511 | 80,624 | 16.4 | 7.5 | 8.8 | -1.6 | 7.2 | 2.34 | 190,169 |
| 1972 | 9,178,000 | 147,813 | 71,866 | 75,947 | 16.1 | 7.8 | 8.3 | -1.0 | 7.3 | 2.36 | 185,101 |
| 1973 | 9,245,000 | 144,729 | 73,927 | 70,802 | 15.7 | 8.0 | 7.7 | -0.5 | 7.2 | 2.29 | 193,503 |
| 1974 | 9,312,000 | 146,876 | 73,181 | 73,695 | 15.8 | 7.9 | 7.9 | -2.0 | 5.9 | 2.24 | 194,247 |
| 1975 | 9,367,000 | 146,517 | 79,701 | 66,816 | 15.6 | 8.5 | 7.1 | -1.5 | 5.5 | 2.20 | 194,710 |
| 1976 | 9,411,000 | 147,912 | 82,400 | 65,512 | 15.7 | 8.8 | 7.0 | -1.5 | 5.5 | 2.16 | 199,121 |
| 1977 | 9,463,000 | 148,963 | 84,565 | 64,398 | 15.7 | 8.9 | 6.8 | -0.2 | 6.6 | 2.11 | 202,146 |
| 1978 | 9,525,000 | 151,053 | 86,612 | 64,441 | 15.9 | 9.1 | 6.8 | 0.0 | 6.8 | 2.08 | 201,619 |
| 1979 | 9,590,000 | 151,800 | 90,837 | 60,963 | 15.8 | 9.5 | 6.4 | 0.7 | 7.1 | 2.05 | 203,446 |
| 1980 | 9,658,000 | 154,432 | 95,514 | 58,918 | 16.0 | 9.9 | 6.1 | 1.6 | 7.7 | 2.04 | 201,852 |
| 1981 | 9,732,000 | 157,899 | 93,136 | 64,763 | 16.2 | 9.6 | 6.7 | 0.7 | 7.4 | 2.08 | 202,340 |
| 1982 | 9,804,000 | 159,364 | 93,840 | 65,524 | 16.3 | 9.6 | 6.7 | 0.2 | 6.9 | 2.02 | 198,011 |
| 1983 | 9,872,000 | 173,510 | 97,849 | 75,661 | 17.6 | 9.9 | 7.7 | -1.0 | 6.7 | 2.09 | 207,461 |
| 1984 | 9,938,000 | 168,749 | 104,274 | 64,475 | 17.0 | 10.5 | 6.5 | -0.4 | 6.1 | 2.14 | 210,844 |
| 1985 | 9,999,000 | 165,034 | 105,690 | 59,344 | 16.6 | 10.6 | 5.9 | 0.0 | 5.9 | 2.09 | 200,888 |
| 1986 | 10,058,000 | 171,611 | 97,276 | 74,335 | 17.1 | 9.7 | 7.4 | -2.1 | 5.3 | 2.10 | 171,114 |
| 1987 | 10,111,000 | 162,937 | 99,921 | 63,016 | 16.2 | 9.9 | 6.2 | -2.9 | 3.3 | 2.04 | 163,761 |
| 1988 | 10,144,000 | 163,193 | 102,671 | 60,522 | 16.1 | 10.1 | 6.0 | -3.3 | 2.7 | 2.03 | 140,921 |
| 1989 | 10,171,000 | 153,449 | 103,479 | 49,970 | 15.1 | 10.2 | 4.9 | -3.1 | 1.8 | 2.03 | 256,041 |
| 1990 [11] | 10,188,942 | 142,167 | 109,582 | 32,585 | 14.0 | 10.8 | 3.2 | -3.1 | 0.1 | 1.91 | 260,839 |
| 1991 | 10,189,753 | 132,045 | 114,650 | 17,395 | 13.0 | 11.2 | 1.7 | -0.9 | 0.8 | 1.81 | 241,138 |
| 1992 | 10,198,346 | 127,971 | 116,674 | 11,297 | 12.5 | 11.4 | 1.1 | 2.5 | 3.6 | 1.76 | 240,387 |
| 1993 | 10,234,593 | 117,384 | 128,544 | -11,160 | 11.5 | 12.6 | -1.1 | 2.0 | 0.9 | 1.62 | 217,957 |
| 1994 | 10,243,506 | 110,599 | 130,003 | -19,404 | 10.8 | 12.7 | -1.9 | -1.3 | -3.2 | 1.53 | 212,533 |
| 1995 | 10,210,403 | 101,144 | 133,775 | -32,631 | 9.9 | 13.1 | -3.2 | 0 | -3.2 | 1.41 | 193,280 |
| 1996 | 10,177,258 | 95,798 | 133,422 | -37,624 | 9.4 | 13.1 | -3.7 | 0.2 | -3.5 | 1.34 | 174,098 |
| 1997 | 10,141,880 | 89,586 | 136,653 | -47,067 | 8.9 | 13.5 | -4.7 | -0.1 | -4.8 | 1.25 | 152,660 |
| 1998 | 10,092,986 | 92,645 | 137,296 | -44,651 | 9.2 | 13.6 | -4.4 | 0.2 | -4.2 | 1.30 | 145,339 |
| 1999 | 10,050,940 | 92,975 | 142,027 | -49,052 | 9.3 | 14.2 | -4.9 | 0.1 | -4.8 | 1.31 | 135,829 |
| 2000 | 10,002,535 | 93,691 | 134,867 | -41,176 | 9.4 | 13.5 | -4.1 | -0.5 | -4.6 | 1.32 | 121,895 |
| 2001 | 9,956,684 | 91,720 | 140,299 | -48,579 | 9.2 | 14.1 | -4.9 | -0.8 | -5.7 | 1.29 | 101,402 |
| 2002 | 9,900,414 | 88,743 | 146,655 | -57,912 | 9.0 | 14.9 | -5.9 | -1.1 | -7.0 | 1.24 | 89,895 |
| 2003 | 9,830,681 | 88,512 | 143,200 | -54,688 | 9.0 | 14.6 | -5.6 | -1.3 | -6.9 | 1.23 | 80,174 |
| 2004 | 9,762,817 | 88,943 | 140,064 | -51,121 | 9.1 | 14.4 | -5.3 | -1.6 | -6.9 | 1.23 | 71,700 |
| 2005 | 9,697,475 | 90,508 | 141,857 | -51,349 | 9.4 | 14.7 | -5.3 | -1.5 | -6.9 | 1.25 | 64,655 |
| 2006 | 9,630,354 | 96,721 | 138,426 | -41,705 | 10.1 | 14.4 | -4.3 | -1.0 | -5.3 | 1.34 | 58,516 |
| 2007 | 9,579,493 | 103,626 | 132,993 | -29,367 | 10.8 | 13.9 | -3.1 | -0.8 | -3.9 | 1.43 | 46,287 |
| 2008 | 9,542,412 | 107,876 | 133,879 | -26,003 | 11.3 | 14.1 | -2.7 | -0.3 | -3.0 | 1.49 | 42,197 |
| 2009 | 9,513,557 | 109,263 | 135,097 | -25,834 | 11.5 | 14.2 | -2.7 | 0.8 | -1.9 | 1.51 | 35,967 |
| 2010 | 9,495,608 | 108,050 | 137,132 | -29,082 | 11.4 | 14.5 | -3.1 | 0.6 | -2.5 | 1.49 | 33,262 |
| 2011 | 9,472,064 | 109,147 | 135,090 | -25,943 | 11.5 | 14.3 | -2.7 | 0.5 | -2.2 | 1.52 | 32,031 |
| 2012 | 9,451,221 | 115,893 | 126,531 | -10,638 | 12.3 | 13.4 | -1.1 | 0.2 | -0.9 | 1.62 | 28,628 |
| 2013 | 9,442,450 | 117,997 | 125,326 | -7,329 | 12.5 | 13.3 | -0.8 | 1.0 | 0.2 | 1.67 | 31,206 |
| 2014 | 9,443,972 | 118,534 | 121,542 | -3,008 | 12.5 | 12.9 | -0.3 | 1.3 | 1.0 | 1.70 | 29,797 |
| 2015 | 9,453,058 | 119,028 | 120,026 | -998 | 12.6 | 12.7 | -0.1 | 1.8 | 1.7 | 1.72 | 29,217 |
| 2016 | 9,469,400 | 117,779 | 119,379 | -1,600 | 12.4 | 12.6 | -0.2 | 0.2 | 0.0 | 1.73 | 27,467 |
| 2017 | 9,469,093 | 102,556 | 119,311 | -16,755 | 10.8 | 12.6 | -1.8 | -0.4 | -2.2 | 1.54 | |
| 2018 | 9,448,312 | 94,042 | 120,053 | -26,011 | 10.0 | 12.7 | -2.8 | 0.8 | -2.0 | 1.45 | |
| 2019 | 9,429,257 | 87,602 | 120,470 | -32,868 | 9.3 | 12.8 | -3.5 | 1.5 | -2.0 | 1.38 | |
| 2020 | 9,410,259 | 83,015 | 144,536 | -61,651 | 8.9 | 15.4 | -6.5 | 0.1 | -6.4 | 1.33 | |
| 2021 | 9,349,645 | 79,732 | 173,853 | -94,121 | 8.6 | 18.7 | -10.1 | 0.0 | -10.1 | 1.29 | |
| 2022 | 9,255,524 | 73,906 | 128,813 | -54,907 | 8.0 | 14.0 | -5.9 | 0.0 | -5.9 | ||
| 2023 | 9,155,978 | 65,000 |
Current vital statistics
This section needs to be updated. (March 2024) |
| Period | Live births | Deaths | Natural increase |
|---|---|---|---|
| January - March 2019 | 21,519 | 32,229 | -10,710 |
| January - March 2020 | 20,180 | 31,039 | -10,859 |
| Difference |
Structure of the population
| Age Group | Male | Female | Total | % |
|---|---|---|---|---|
| Total | 4 351 473 | 5 061 973 | 9 413 446 | 100 |
| 0–4 | 270 610 | 255 488 | 526 098 | 5.59 |
| 5–9 | 288 068 | 273 160 | 561 228 | 5.96 |
| 10–14 | 259 437 | 246 882 | 506 319 | 5.38 |
| 15–19 | 234 423 | 221 344 | 455 767 | 4.84 |
| 20–24 | 228 635 | 219 413 | 448 048 | 4.76 |
| 25–29 | 305 775 | 310 546 | 616 321 | 6.55 |
| 30–34 | 388 316 | 392 937 | 781 253 | 8.30 |
| 35–39 | 367 695 | 381 356 | 749 051 | 7.96 |
| 40–44 | 325 233 | 345 140 | 670 373 | 7.12 |
| 45–49 | 302 148 | 337 685 | 639 833 | 6.80 |
| 50–54 | 289 385 | 333 961 | 623 346 | 6.62 |
| 55–59 | 319 173 | 385 127 | 704 300 | 7.48 |
| 60–64 | 292 835 | 387 326 | 680 161 | 7.23 |
| 65-69 | 202 723 | 310 845 | 513 568 | 5.46 |
| 70-74 | 123 837 | 219 468 | 343 305 | 3.65 |
| 75-79 | 67 798 | 160 061 | 227 859 | 2.42 |
| 80-84 | 55 715 | 164 022 | 219 737 | 2.33 |
| 85-89 | 21 467 | 80 001 | 101 468 | 1.08 |
| 90-94 | 7 173 | 31 583 | 38 756 | 0.41 |
| 95-99 | 966 | 5 300 | 6 266 | 0.07 |
| 100+ | 61 | 328 | 389 | <0.01 |
| Age group | Male | Female | Total | Percent |
| 0–14 | 818 115 | 775 530 | 1 593 645 | 16.93 |
| 15–64 | 3 053 618 | 3 314 835 | 6 368 453 | 67.65 |
| 65+ | 479 740 | 971 608 | 1 451 348 | 15.42 |
- Belarusians 84.9%, Russians 7.5%, Poles 3.1%, Ukrainians 1.7%, Jews 0.1%, Armenians 0.1%, Lipka Tatars 0.1%, Ruska Roma 0.1%, Lithuanians 0.1%, Azerbaijanis 0.1%, others 2.2% (2019 census).
Prior to the Second World War
Prior to World War II, Jews were the second largest ethnic group in Belarus, and at 400,000 in the 1926 and 1939 censuses they even exceeded the number of Russians (although admittedly by a small margin).[14] Jews accounted for 7%–8% of the total population at that time, comprising more than 40% of the population in cities and towns, where Jews and Poles were the majority, while Belarusians mostly lived in rural areas.
The Poles were the fourth largest ethnic group in Byelorussian SSR (current Eastern portion of Belarus), before World War II, comprising 1–2% of the population in the pre-war censuses (less than 100,000).[14]
| Ethnic group |
census 19261 | census 19392 | ||
|---|---|---|---|---|
| Number | % | Number | % | |
| Belarusians | 4,017,301 | 80.6 | 4,615,496 | 82.9 |
| Jews | 407,059 | 8.2 | 375,092 | 6.7 |
| Russians | 383,806 | 7.7 | 364,705 | 6.6 |
| Poles | 97,498 | 2.0 | 58,380 | 1.1 |
| Ukrainians | 34,681 | 0.7 | 104,247 | 1.9 |
| Germans | 7,075 | 0.1 | 8,448 | 0.2 |
| Latvians | 14,080 | 0.3 | 8,117 | 0.2 |
| Tatars | 3,777 | 0.1 | 7,664 | 0.1 |
| Lithuanians | 6,864 | 0.1 | 4,284 | 0.1 |
| Roma | 2,366 | 0.1 | 3,632 | 0.1 |
| Mordvins | 1,051 | 0.0 | 2,042 | 0.0 |
| Others | 7,682 | 0.2 | 16,887 | 0.3 |
| Total | 4,983,240 | 5,568,994 | ||
| 1 Source: . 2 Source: Archived 2012-12-21 at archive.today. | ||||
After the Second World War
The Holocaust decimated the Jewish population in Belarus, and after World War II, in 1959, Jews accounted for only 1.9% of the population. Since then, Jewish emigration to Israel and other countries reduced the number of Jews to 0.1% of the population (13,000 in 2009).
After the war, a large number of Poles were forced to move to Poland. In exchange, Belarusians from the former Belastok Region, which was returned to Poland in 1945, after being occupied in 1939 were displaced to Belarus. Due to changes in the western border of Belarus and Poland after World War II (see territorial changes of Poland), the number of Poles in Belarus increased to more than 500,000 according to the first post-war census (1959) and to about 400,000 according to the 1999 census. Poles are now the third largest ethnic group in Belarus (see Polish minority in Belarus). There are around 15,000 of Lipka Tatars and about 10,000 of Ruska Roma (Russian Gypsies).
In the post-war period Belarus experienced an influx of workers from other parts of the Soviet Union, for example Russians and Ukrainians. The decade after independence saw a decline in the population of most of these minority groups, either by assimilation or emigration. The most significant exception to this trend has been a continued (if small-scale) net immigration of Armenians and Azerbaijanis, whose numbers increased from less than 2,000 in 1959 to around 10,000 in 1999.[3]
| Belarusian | Russians | Poles | Ukrainians |
.png)
.png)
.png)
.png)
| Belarusian | Russians | Poles | Ukrainians |
| Ethnic group |
census 19591 | census 19702 | census 19793 | census 19894 | census 19995 | census 20096 | census 20197 | |||||||
|---|---|---|---|---|---|---|---|---|---|---|---|---|---|---|
| Number | % | Number | % | Number | % | Number | % | Number | % | Number | % | Number | % | |
| Belarusians | 6,532,035 | 81.1 | 7,289,610 | 81.0 | 7,567,955 | 79.4 | 7,904,623 | 77.9 | 8,158,900 | 81.2 | 7,957,252 | 83.7 | 7,990,719 | 84.9 |
| Russians | 659,093 | 8.2 | 938,161 | 10.4 | 1,134,117 | 11.9 | 1,342,099 | 13.2 | 1,141,700 | 11.4 | 785,084 | 8.3 | 706,992 | 7.5 |
| Poles | 538,881 | 6.7 | 382,600 | 4.3 | 403,169 | 4.2 | 417,720 | 4.1 | 395,700 | 3.9 | 294,549 | 3.1 | 287,693 | 3.1 |
| Ukrainians | 133,061 | 1.7 | 190,839 | 2.1 | 230,985 | 2.4 | 291,008 | 2.9 | 237,000 | 2.4 | 158,723 | 1.7 | 159,656 | 1.7 |
| Jews | 150,084 | 1.9 | 148,011 | 1.6 | 135,450 | 1.4 | 111,975 | 1.1 | 27,800 | 0.3 | 12,926 | 0.1 | 13,705 | 0.1 |
| Armenians | 1,751 | 0.0 | 2,362 | 0.0 | 2,751 | 0.0 | 4,933 | 0.1 | 10,200 | 0.1 | 8,512 | 0.1 | 9,392 | 0.1 |
| Tatars | 8,650 | 0.1 | 9,992 | 0.1 | 10,851 | 0.1 | 12,436 | 0.1 | 10,100 | 0.1 | 7,316 | 0.1 | 8,445 | 0.1 |
| Romani | 4,662 | 0.1 | 6,843 | 0.1 | 8,408 | 0.1 | 10,762 | 0.1 | 9,900 | 0.1 | 7,079 | 0.1 | 6,848 | 0.1 |
| Azerbaijanis | 1,402 | 0.0 | 1,335 | 0.0 | 2,654 | 0.0 | 5,009 | 0.1 | 6,300 | 0.1 | 5,567 | 0.1 | 6,001 | 0.1 |
| Lithuanians | 8,363 | 0.1 | 8,092 | 0.1 | 6,993 | 0.1 | 7,606 | 0.1 | 6,400 | 0.1 | 5,087 | 0.1 | 5,287 | 0.1 |
| Others | 16,666 | 0.2 | 24,493 | 0.3 | 29,183 | 0.3 | 43,635 | 0.4 | 41,200 | 0.4 | 261,712 | 2.8 | 218,708 | 2.3 |
| Total | 8,054,648 | 9,002,338 | 9,532,516 | 10,151,806 | 10,045,200 | 9,503,807 | 9,413,446 | |||||||
| 1 Source: . 2 Source: . 3 Source: . 4 Source: . 5 Source: . 6 Source: . 7 Source: . | ||||||||||||||
Belarusian and Russian are the official languages according to the Constitution of Belarus (Article 17). The constitution guarantees preservation of the cultural heritage of all ethnic minorities, including their languages (Article 15). Russian, and not Belarusian, is the dominant language in Belarus, spoken normally at home by 70% of the population (2009 census). Major cities such as Minsk and Brest are overwhelmingly Russian-speaking.
| Native languages | Spoken languages |
According to 1997 estimates, 80% of the religious population belonged to the Eastern Orthodox Church and the others are mainly Roman Catholic, Greek Catholic, Protestants, Muslims, and Jews.[15]
Figures for 2020 state that 78% of the population have a Christian background (this includes 60% Orthodox and 10% Catholic). Of the rest, almost 22% are non-religious, with a very small number of Jews and Sunni Muslims.[16]
- Urban population: 75% of total population (2011)
- Rate of urbanization: 0.21% annual rate of change (2010–2015 est.)
- "Belarus: historical demographical data of the whole country". Populstat. Archived from the original on 14 April 2018. Retrieved 6 July 2017.
- Ethnic composition of the population Archived February 7, 2009, at the Wayback Machine, 1999 Belarus Census.
- Population estimates 1995–2007 Archived 2008-12-03 at the Wayback Machine, BelStat
- Statistical Yearbook of the Republic of Belarus 2007, BelStat, Minsk, 2007
- "Population on January 1, 2018 by regions of the Republic of Belarus" (in Russian). Белстат. 2018.
- "Belarus ranks 6th in population the CIS countries" (in Russian). БЕЛТА. 2018-07-06.
- "Division of Belarus". pop-stat.mashke.org.
- "Demographic Data". demdata.belstat.gov.by. 2016. Archived from the original on 2021-04-04. Retrieved 2018-06-23.
- "Статистический ежегодник Российской Империи (Издание ЦСК ) - Проект "Исторические Материалы"". istmat.info. Archived from the original on 2014-12-16. Retrieved 2014-12-24.
- "Бюллетени". www.belstat.gov.by.
- "UNSD — Demographic and Social Statistics". unstats.un.org. Retrieved 2023-05-10.
- "Приложение Демоскопа Weekly". demoscope.ru.
- "The World Factbook - Central Intelligence Agency". www.cia.gov. 28 October 2022.