1973-75_recession.jpg
No higher resolution available.
Summary
| Description |
English:
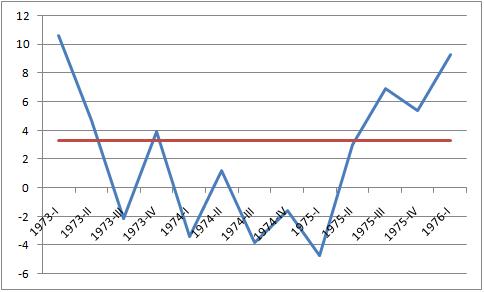
A graph of the recession in the United States from 1973-75.
|
||
| Date | |||
| Source | Own work | ||
| Author | JayHenry | ||
|
Permission
( Reusing this file ) |
|

|
This
graph
image could be re-created
using
vector graphics
as an
SVG
file
. This has several advantages; see
Commons:Media for cleanup
for more information. If an SVG form of this image is available, please upload it and afterwards replace this template with
{{

vector version available

|

new image name

}}
.
It is recommended to name the SVG file “1973-75 recession.svg”—then the template Vector version available (or Vva ) does not need the new image name parameter. |


Licensing
|
|
I, the copyright holder of this work, release this work into the
public domain
. This applies worldwide.
In some countries this may not be legally possible; if so: I grant anyone the right to use this work for any purpose , without any conditions, unless such conditions are required by law. |