1999-2014_UK_foreign_trade_share_graph.png
Size of this preview:
800 × 374 pixels
.
Other resolutions:
320 × 150 pixels
|
981 × 459 pixels
.
Summary
| Description |
English:
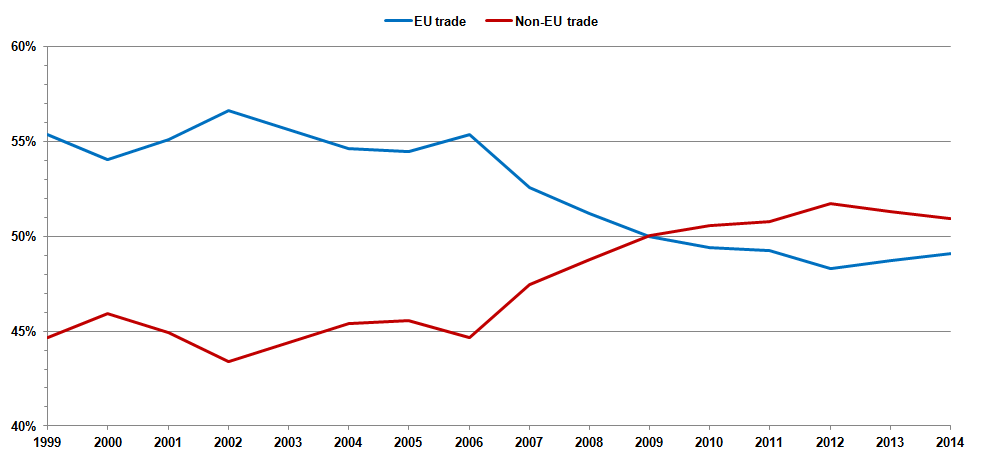
Connected scatter graph showing the United Kingdom's combined imports and exports between EU and non-EU countries from the year 1999 through to 2014.
|
| Date | |
| Source | Office for National Statistics , 26 June 2015 |
| Author | Jolly Janner |
| Other versions |
|


Data
| Year | EU trade | Non EU trade |
|---|---|---|
| 1999 | 55.3% | 44.7% |
| 2000 | 54.1% | 45.9% |
| 2001 | 55.1% | 44.9% |
| 2002 | 56.6% | 43.4% |
| 2003 | 55.6% | 44.4% |
| 2004 | 54.6% | 45.4% |
| 2005 | 54.5% | 45.5% |
| 2006 | 55.4% | 44.6% |
| 2007 | 52.6% | 47.4% |
| 2008 | 51.2% | 48.8% |
| 2009 | 50.0% | 50.0% |
| 2010 | 49.4% | 50.6% |
| 2011 | 49.2% | 50.8% |
| 2012 | 48.3% | 51.7% |
| 2013 | 48.7% | 51.3% |
| 2014 | 49.1% | 50.9% |
Licensing
I, the copyright holder of this work, hereby publish it under the following license:
|
|
This file is made available under the Creative Commons CC0 1.0 Universal Public Domain Dedication . |
|
The person who associated a work with this deed has dedicated the work to the
public domain
by waiving all of their rights to the work worldwide under copyright law, including all related and neighboring rights, to the extent allowed by law. You can copy, modify, distribute and perform the work, even for commercial purposes, all without asking permission.
|