2016_Presidential_Election_by_Vote_Distribution_Among_States.svg

Size of this PNG preview of this SVG file:
800 × 495 pixels
.
Other resolutions:
320 × 198 pixels
|
640 × 396 pixels
|
1,024 × 633 pixels
|
1,280 × 791 pixels
|
2,560 × 1,583 pixels
|
959 × 593 pixels
.
Summary
| Description |
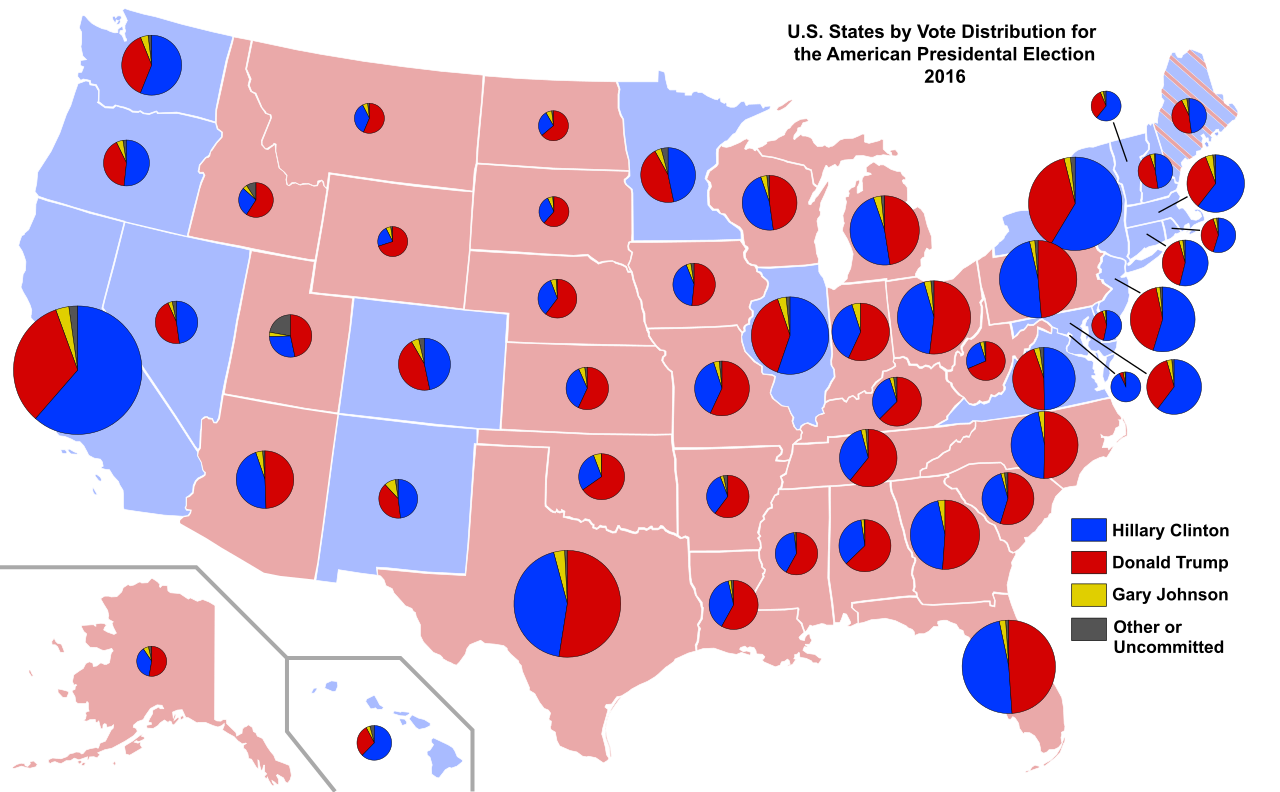
English:
2016 Presidential Election
by Vote Distribution Among States. Each state's pie chart is
proportional to the number of electoral colleges
they have.
|
||||
| Date | |||||
| Source | Own work ; used Blank US Map.svg . | ||||
| Author | Ali Zifan | ||||
| Other versions |
[
]
|


.svg)
.svg)


Licensing
I, the copyright holder of this work, hereby publish it under the following license:
This file is licensed under the
Creative Commons
Attribution-Share Alike 4.0 International
license.
-
You are free:
- to share – to copy, distribute and transmit the work
- to remix – to adapt the work
-
Under the following conditions:
- attribution – You must give appropriate credit, provide a link to the license, and indicate if changes were made. You may do so in any reasonable manner, but not in any way that suggests the licensor endorses you or your use.
- share alike – If you remix, transform, or build upon the material, you must distribute your contributions under the same or compatible license as the original.