20200509_Emergence_of_temperatures_from_range_of_normal_historical_variability_-_tropical_vs_northern_Americas_(Hawkins).gif

Size of this preview:
800 × 600 pixels
.
Other resolutions:
320 × 240 pixels
|
640 × 480 pixels
|
1,000 × 750 pixels
.
Summary
| Description |
English:
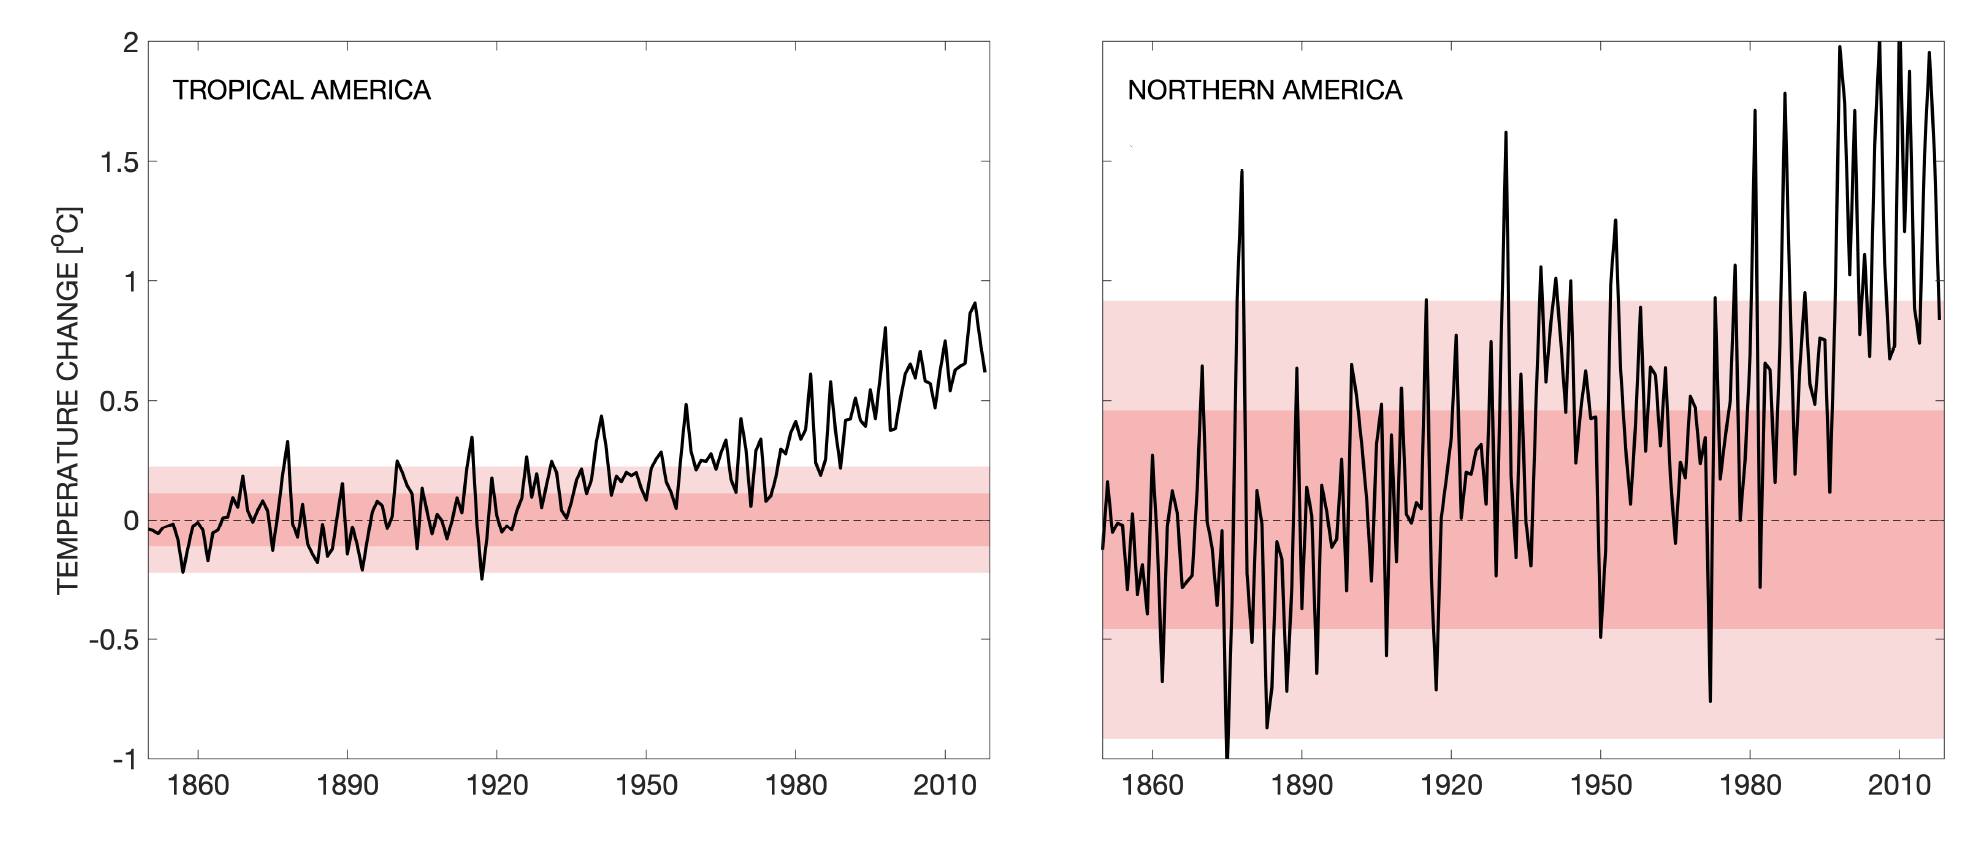
Animated graphic of temperature changes in tropical America and in Northern America, atop 1 and 2 standard deviations of normal variability.
|
| Date | |
| Source | Own work |
| Author | RCraig09 |
| Other versions |
.svg)
(non-animated, SVG predecessor, showing both graphs at once) |
Licensing
Climate Lab Book source (Ed Hawkins) states:
"These blog pages & images are licensed under a Creative Commons Attribution-ShareAlike 4.0 International License."
This file is licensed under the
Creative Commons
Attribution-Share Alike 4.0 International
license.
-
You are free:
- to share – to copy, distribute and transmit the work
- to remix – to adapt the work
-
Under the following conditions:
- attribution – You must give appropriate credit, provide a link to the license, and indicate if changes were made. You may do so in any reasonable manner, but not in any way that suggests the licensor endorses you or your use.
- share alike – If you remix, transform, or build upon the material, you must distribute your contributions under the same or compatible license as the original.
Uploader's graphical rendition:
I, the copyright holder of this work, hereby publish it under the following license:
This file is licensed under the
Creative Commons
Attribution-Share Alike 4.0 International
license.
-
You are free:
- to share – to copy, distribute and transmit the work
- to remix – to adapt the work
-
Under the following conditions:
- attribution – You must give appropriate credit, provide a link to the license, and indicate if changes were made. You may do so in any reasonable manner, but not in any way that suggests the licensor endorses you or your use.
- share alike – If you remix, transform, or build upon the material, you must distribute your contributions under the same or compatible license as the original.