AntarcticBedrock.jpg

Size of this preview:
600 × 600 pixels
.
Other resolutions:
240 × 240 pixels
|
480 × 480 pixels
|
768 × 768 pixels
|
1,024 × 1,024 pixels
|
1,400 × 1,400 pixels
.
Summary
| Description |
English:
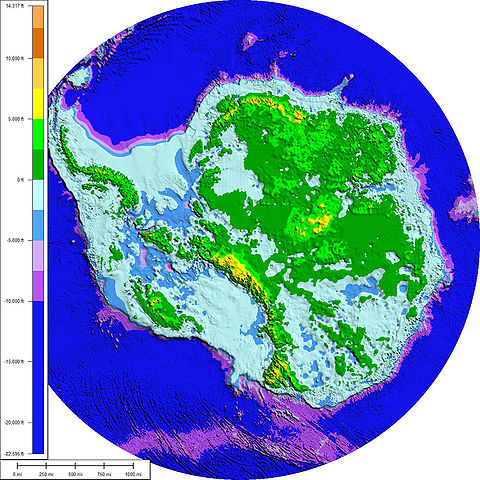
The above map shows the subglacial topography and bathymetry of
Antarctica
. As indicated by the scale on left-hand side, the different shades of blue and purple indicate parts of the ocean floor and sub-ice bedrock, which are below sea level. The other colours indicate Antarctic bedrock lying above sea level. Each colour represents an interval of 2,500 feet in elevation. Map is not corrected for sea level rise or isostatic rebound, which would occur if the Antarctic ice sheet completely melted to expose the bedrock surface.
Français :
La carte ci-dessus montre la topographie et la bathymétrie sous-glaciaires de l'
Antarctique
. Comme l'indique l'échelle de gauche, les différentes nuances de bleu et de violet indiquent les parties du fond océanique et du substrat rocheux sous-glaciaire qui sont situées sous le niveau de la mer. Les autres couleurs indiquent les parties du substrat rocheux situées au-dessus du niveau de la mer. Chaque couleur représente un intervalle d'environ 800 mètres (2 500 pieds) d'altitude. La carte n'est pas corrigée de l'élévation du niveau de la mer ou du rebond isostatique qui se produirait si la calotte glaciaire antarctique fondait entièrement, libérant la surface du substrat rocheux.
Čeština:
Výše uvedená mapa zobrazuje subglaciální topografii a batymetrii
Antarktidy
. Jak naznačuje měřítko na levé straně, různé odstíny modré a fialové barvy označují části oceánského dna a podledovcového podloží, které se nacházejí pod hladinou moře. Ostatní barvy označují antarktické podloží, které leží nad hladinou moře. Každá barva představuje interval o výšce 2 500 stop (762 m). Mapa není korigována o vzestup mořské hladiny nebo izostatický odraz, ke kterému by došlo, kdyby antarktický ledový příkrov zcela roztál a obnažil povrch skalního podloží.
|
| Date | |
| Source | This map was prepared from BEDMAP gridded data-set for bed-elevation south of 60 degrees S using Global Mapper 7.0.1. The faint rectilinear pattern seen in the shaded relief is an artifact of the gridding of data from linear seismic surveys. The data used to make this map came from "A new ice thickness and subglacial topographic model of the Antarctic" prepared by the BEDMAP Consortium, which is sponsored by the European Ice Sheet Modelling Initiative, Scientific Committee on Antarctic Research. |
| Author | Paul V. heinrich |
Licensing
I, the copyright holder of this work, hereby publish it under the following license:
This file is licensed under the
Creative Commons
Attribution 3.0 Unported
license.
-
You are free:
- to share – to copy, distribute and transmit the work
- to remix – to adapt the work
-
Under the following conditions:
- attribution – You must give appropriate credit, provide a link to the license, and indicate if changes were made. You may do so in any reasonable manner, but not in any way that suggests the licensor endorses you or your use.