Boxplot_vs_PDF.svg

Size of this PNG preview of this SVG file:
550 × 600 pixels
.
Other resolutions:
220 × 240 pixels
|
440 × 480 pixels
|
704 × 768 pixels
|
939 × 1,024 pixels
|
1,878 × 2,048 pixels
|
598 × 652 pixels
.
Summary
| Description |
English:
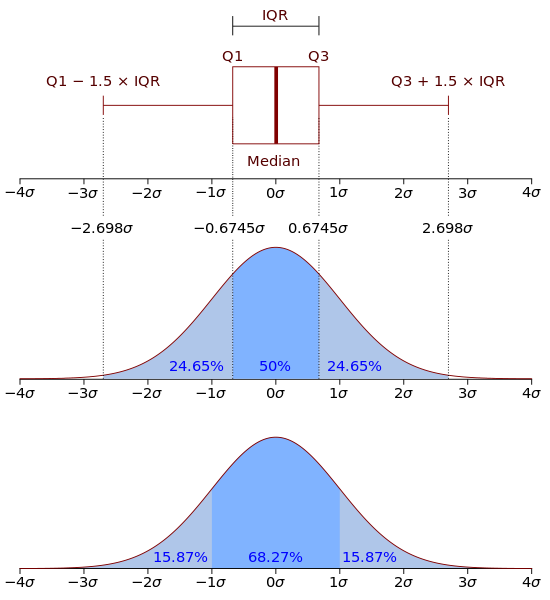
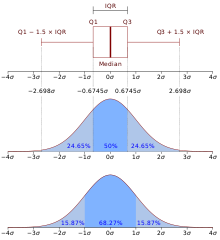
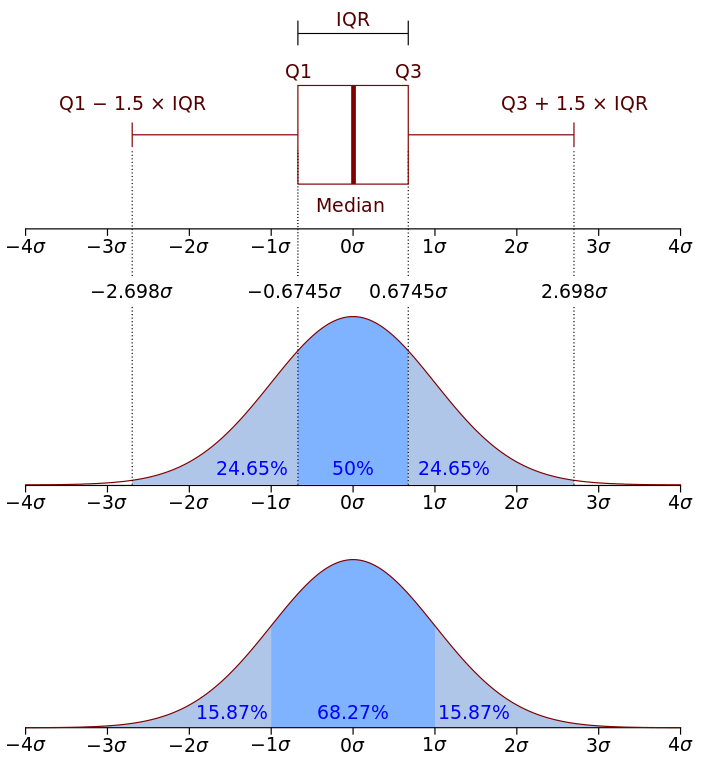
Boxplot and a
probability density function
(pdf) of a Normal N(0,1σ
2
) Population.
|
| Date | |
| Source | |
| Author |
|
| Other versions |
|


|
|
This is a
retouched picture
, which means that it has been digitally altered from its original version. Modifications:
Recreated using vector graphics as an SVG file
. The original can be viewed here:
Boxplot vs PDF.png
:
|
Licensing
This file is licensed under the
Creative Commons
Attribution-Share Alike 2.5 Generic
license.
Attribution:
Jhguch
at
en.wikipedia
-
You are free:
- to share – to copy, distribute and transmit the work
- to remix – to adapt the work
-
Under the following conditions:
- attribution – You must give appropriate credit, provide a link to the license, and indicate if changes were made. You may do so in any reasonable manner, but not in any way that suggests the licensor endorses you or your use.
- share alike – If you remix, transform, or build upon the material, you must distribute your contributions under the same or compatible license as the original.
All translations
Translations added to this section should be free of copyright claims (either CC0 or public domain).
- box plot ≅ box plot (Q895726)
- box plot
- median ≅ median (Q226995)
- median
- interquartile range ≅ interquartile range (Q1916617)
- interquartile range
- interquartile mean ≅ Interquartile mean (Q17077647)
- interquartile mean