CIExy1931_MacAdam.png
Size of this preview:
542 × 599 pixels
.
Other resolutions:
217 × 240 pixels
|
434 × 480 pixels
|
695 × 768 pixels
|
1,140 × 1,260 pixels
.

|
Permission is granted to copy, distribute and/or modify this document under the terms of the GNU Free Documentation License , Version 1.2 or any later version published by the Free Software Foundation ; with no Invariant Sections, no Front-Cover Texts, and no Back-Cover Texts. A copy of the license is included in the section entitled GNU Free Documentation License . |
|
|
This file is licensed under the Creative Commons Attribution-Share Alike 3.0 Unported license. | |
|
||
| This licensing tag was added to this file as part of the GFDL licensing update . |

|
This
diagram
image could be re-created
using
vector graphics
as an
SVG
file
. This has several advantages; see
Commons:Media for cleanup
for more information. If an SVG form of this image is available, please upload it and afterwards replace this template with
{{

vector version available

|

new image name

}}
.
It is recommended to name the SVG file “CIExy1931 MacAdam.svg”—then the template Vector version available (or Vva ) does not need the new image name parameter. |
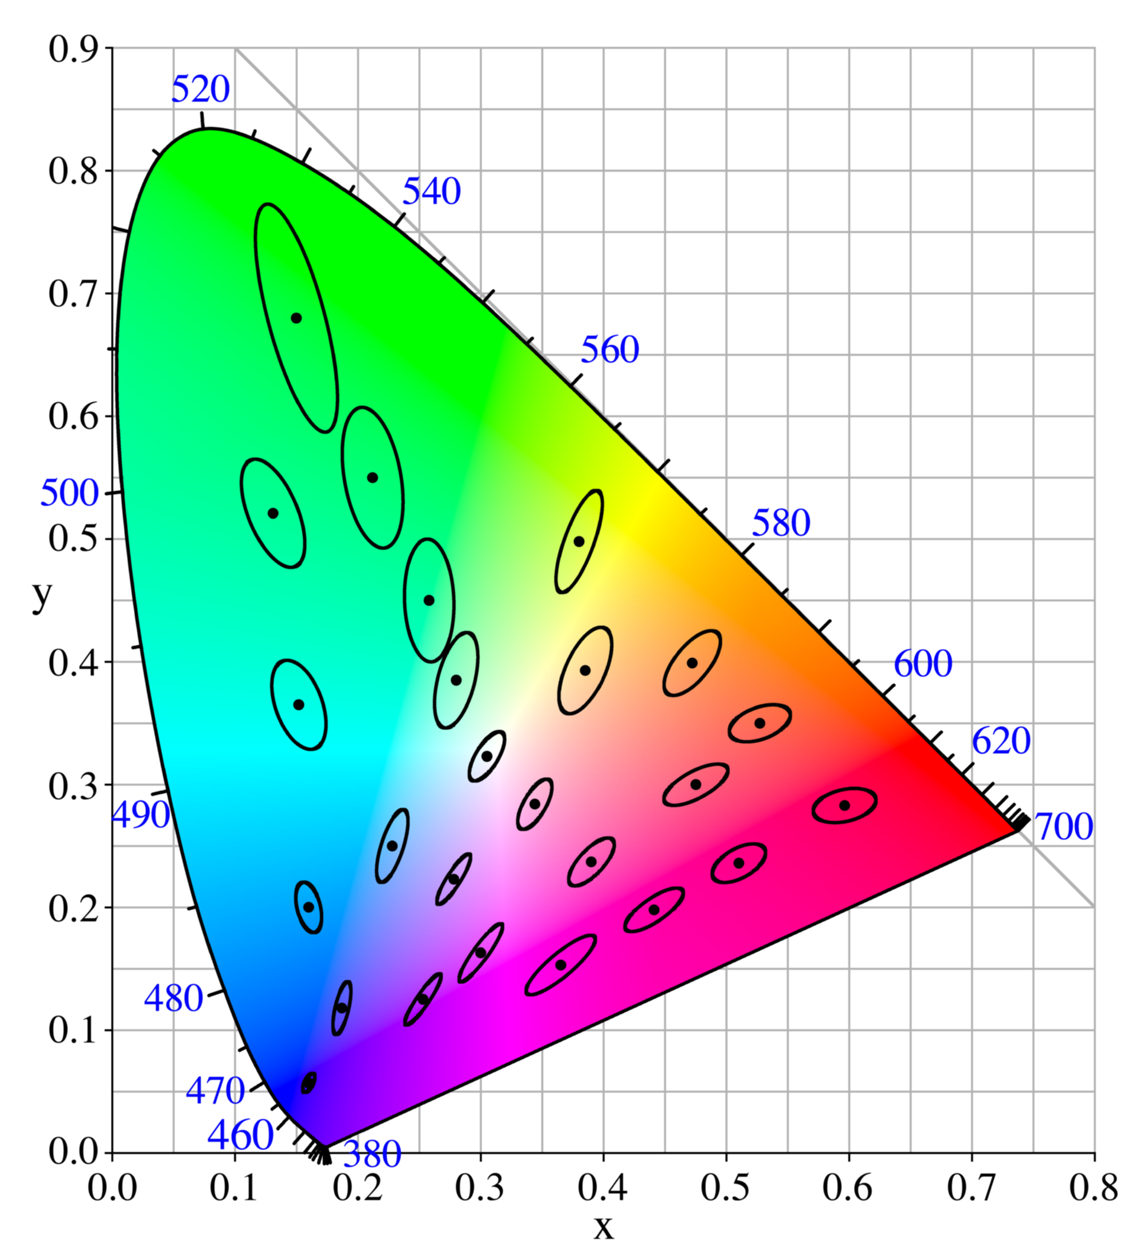
MacAdam(1942) ellipses plotted on the CIE xy 1931 chromaticity diagram. Ellipses are 10 x actual size.
Data taken from Günter Wyszecki and Walter Stanley Stiles, Color Science: Concepts and Methods, Quantitative Data and Formula (2nd edition), Wiley-Interscience. (July 28, 2000). ISBN 0-471-39918-3 , Table 2(5.4.1). Each ellipse is centered at [x,y] in the CIE (xy) chromaticity coordinates, with major and minor radii a and b respectively. t is the angle in degrees of the major axis with respect to the x axis, with positive angles going counter-clockwise.
  x     y  10^3a 10^3b t
0.160 0.057 0.85 0.35  62.5
0.187 0.118 2.20 0.55  77.0
0.253 0.125 2.50 0.50  55.5
0.150 0.680 9.60 2.30 105.0
0.131 0.521 4.70 2.00 112.5
0.212 0.550 5.80 2.30 100.0
0.258 0.450 5.00 2.00  92.0
0.152 0.365 3.80 1.90 110.0
0.280 0.385 4.00 1.50  75.5
0.380 0.498 4.40 1.20  70.0
0.160 0.200 2.10 0.95 104.0
0.228 0.250 3.10 0.90  72.0
0.305 0.323 2.30 0.90  58.0
0.385 0.393 3.80 1.60  65.5
0.472 0.399 3.20 1.40  51.0
0.527 0.350 2.60 1.30  20.0
0.475 0.300 2.90 1.10  28.5
0.510 0.236 2.40 1.20  29.5
0.596 0.283 2.60 1.30  13.0
0.344 0.284 2.30 0.90  60.0
0.390 0.237 2.50 1.00  47.0
0.441 0.198 2.80 0.95  34.5
0.278 0.223 2.40 0.55  57.5
0.300 0.163 2.90 0.60  54.0
0.365 0.153 3.60 0.95  40.0
Plots were made as parametric in f where f ranged from 0 to 2 pi
 aa=a[i]*cos(f)
 bb=b[i]*sin(f)
 xx=x[i]+aa*cos(t[i])-bb*sin(t[i])
 yy=y[i]+aa*sin(t[i])+bb*cos(t[i])
 plot,xx,yy
Please see
Image:CIExy1931.png
for a description of how this image was made.