Change_in_Average_Temperature_With_Fahrenheit.svg

Size of this PNG preview of this SVG file:
666 × 599 pixels
.
Other resolutions:
267 × 240 pixels
|
533 × 480 pixels
|
853 × 768 pixels
|
1,138 × 1,024 pixels
|
2,276 × 2,048 pixels
|
960 × 864 pixels
.
Summary
| Description |
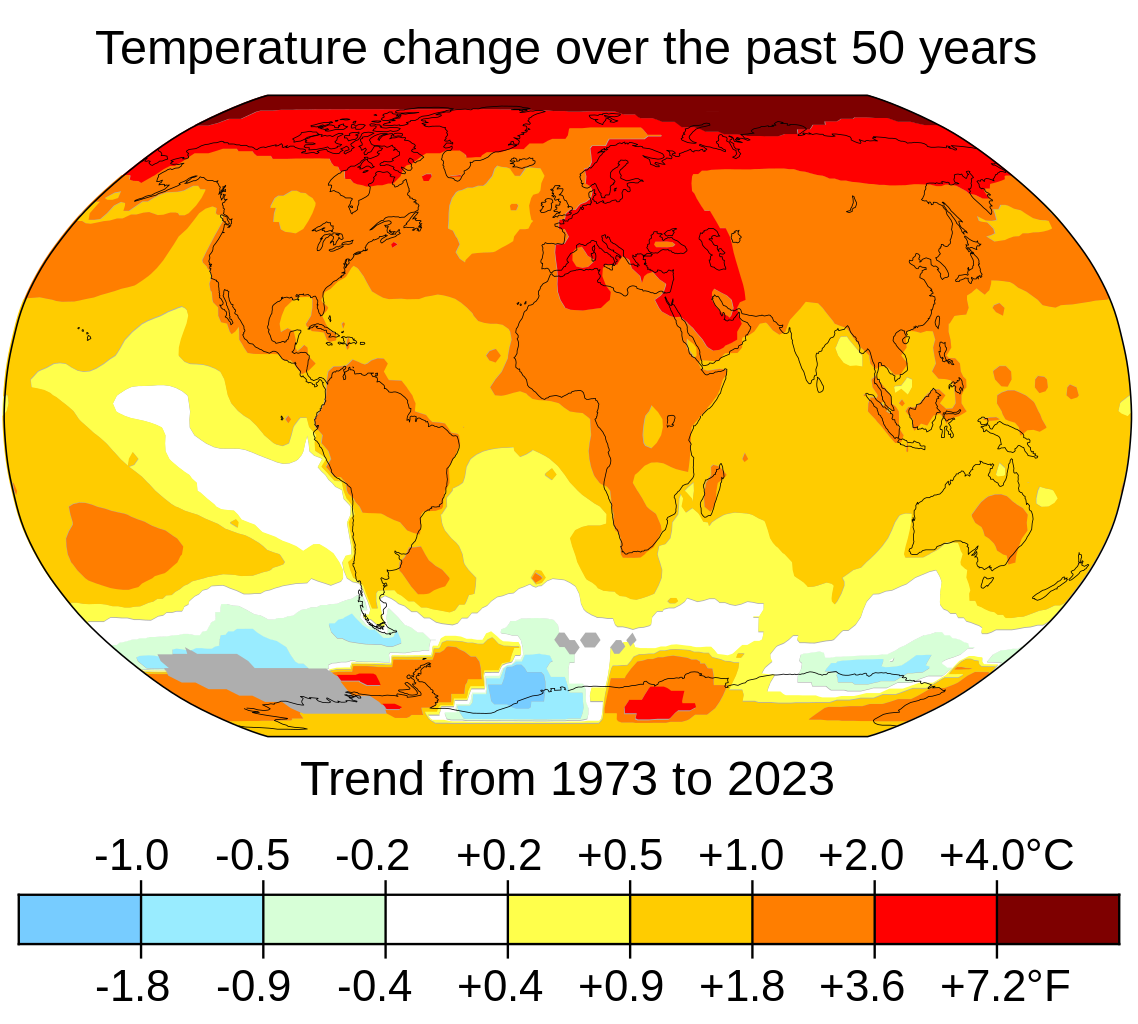
English:
Surface air temperature changes to date have been most pronounced in northern latitudes and over land masses. The image uses the trend of annual averages to smooth out climate variability due to factors such as El Niño. The map is improved from the highest quality rendering that
NASA’s Scientific Visualization Studio
generates, with horizontal and vertical lines removed and with a more legible projection of Kavraiskiy VII. Grey areas in the image have insufficient data for rendering. For a version without Fahrenheit, see
File:Change in Average Temperature.svg
|
| Date | |
| Source | https://data.giss.nasa.gov/gistemp/maps/index_v4.html |
| Author | NASA’s Scientific Visualization Studio, Key and Title by uploader (Eric Fisk) |
| Other versions | Arabic (العربية) , French |
Licensing
I, the copyright holder of this work, hereby publish it under the following license:
This file is licensed under the
Creative Commons
Attribution-Share Alike 4.0 International
license.
-
You are free:
- to share – to copy, distribute and transmit the work
- to remix – to adapt the work
-
Under the following conditions:
- attribution – You must give appropriate credit, provide a link to the license, and indicate if changes were made. You may do so in any reasonable manner, but not in any way that suggests the licensor endorses you or your use.
- share alike – If you remix, transform, or build upon the material, you must distribute your contributions under the same or compatible license as the original.