Countries_by_GDP_(PPP)_per_capita_in_2020.png

Size of this preview:
800 × 366 pixels
.
Other resolutions:
320 × 146 pixels
|
640 × 293 pixels
|
1,024 × 468 pixels
|
1,280 × 586 pixels
|
2,560 × 1,171 pixels
|
5,990 × 2,740 pixels
.
Summary
| Description |
English:
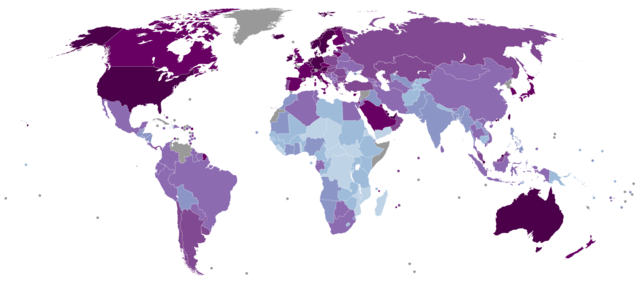
Choropleth map showing countries by GDP (PPP) per capita (Int$) in 2020 according to the
International Monetary Fund
.
>50,000
35,000–50,000
20,000–35,000
10,000–20,000
5,000–10,000
2,000–5,000
<2,000
Data unavailable
|
| Date |
|
| Source |
Own work
|
| Author |
ព្រះមហាក្សត្ររាជ
|
Licensing
I, the copyright holder of this work, hereby publish it under the following license:
This file is licensed under the
Creative Commons
Attribution-Share Alike 4.0 International
license.
-
You are free:
- to share – to copy, distribute and transmit the work
- to remix – to adapt the work
-
Under the following conditions:
- attribution – You must give appropriate credit, provide a link to the license, and indicate if changes were made. You may do so in any reasonable manner, but not in any way that suggests the licensor endorses you or your use.
- share alike – If you remix, transform, or build upon the material, you must distribute your contributions under the same or compatible license as the original.