Europe_DNA_01.jpg

Size of this preview:
800 × 425 pixels
.
Other resolutions:
320 × 170 pixels
|
640 × 340 pixels
|
1,085 × 577 pixels
.
Summary
| Description |
English:
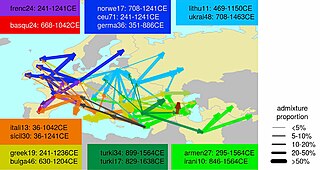
Gene flow within West Eurasia is shown by lines linking the best-matching donor group to the sources of admixture with recipient clusters (arrowhead). Linecolors represent the regional identity of the donor group, and line thickness represents the proportion of DNA coming from the donor group. Ranges of the dates (point estimates) for events involving sources most similar to selected donor groups are shown [Credit: Busby et al./Current Biology 2015]
|
| Date | |
| Source |
Current Biology ISSN: 0960-9822 Volume 25, Issue 19, p2518–2526, 5 October 2015 The Role of Recent Admixture in Forming the Contemporary West Eurasian Genomic Landscape DOI: https://dx.doi.org/10.1016/j.cub.2015.08.007 This is an open access article under the CC BY license ( https://creativecommons.org/licenses/by/4.0/ ). |
| Author | George B.J., Garrett Hellenthal, Francesco Montinaro, Sergio Tofanelli, Kazima Bulayeva, Igor Rudan, Tatijana Zemunik, Caroline Hayward, Draga Toncheva, Sena Karachanak-Yankova, Desislava Nesheva, Paolo Anagnostou, Francesco Cali, Francesca Brisighelli, Valentino Romano, Gerard Lefranc, Catherine Buresi, Jemni Ben Chibani, Amel Haj-Khelil, Sabri Denden, Rafal Ploski, Pawel Krajewski, Tor Hervig, Torolf Moen, Rene J. Herrera, James F. Wilson, Simon Myers, Cristian |
Licensing
This file is licensed under the
Creative Commons
Attribution-Share Alike 4.0 International
license.
-
You are free:
- to share – to copy, distribute and transmit the work
- to remix – to adapt the work
-
Under the following conditions:
- attribution – You must give appropriate credit, provide a link to the license, and indicate if changes were made. You may do so in any reasonable manner, but not in any way that suggests the licensor endorses you or your use.
- share alike – If you remix, transform, or build upon the material, you must distribute your contributions under the same or compatible license as the original.