Europe_Jewish_%_change_1945_2010.png

Size of this preview:
720 × 600 pixels
.
Other resolutions:
288 × 240 pixels
|
576 × 480 pixels
|
922 × 768 pixels
|
1,229 × 1,024 pixels
|
2,458 × 2,048 pixels
.
Summary
| Description |
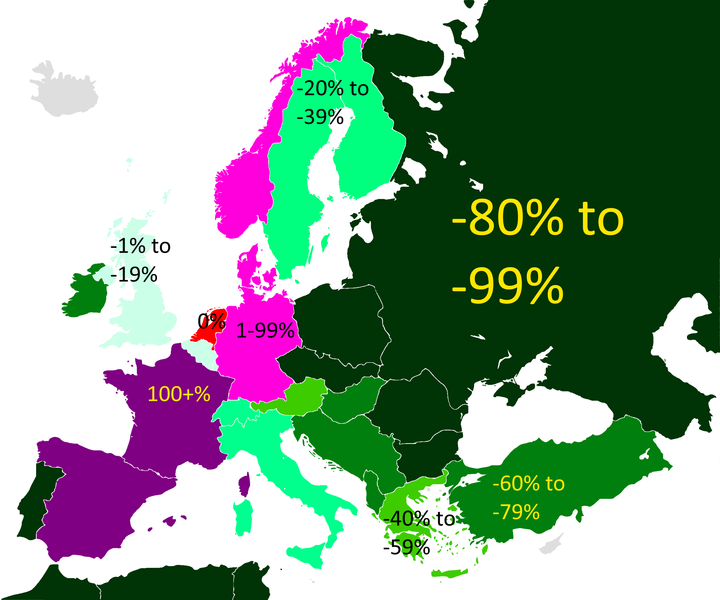
Map of the % change in the Jewish population by each European country between 1945 and 2010
|
| Date | (UTC) |
| Source |
This file was derived from:
West Germany 1956-1990.svg
:

|
| Author |
|
|
|
This is a
retouched picture
, which means that it has been digitally altered from its original version. Modifications:
Changed map
. The original can be viewed here:
West Germany 1956-1990.svg
:
|
Licensing
I, the copyright holder of this work, hereby publish it under the following license:
This file is licensed under the
Creative Commons
Attribution-Share Alike 3.0 Unported
license.
-
You are free:
- to share – to copy, distribute and transmit the work
- to remix – to adapt the work
-
Under the following conditions:
- attribution – You must give appropriate credit, provide a link to the license, and indicate if changes were made. You may do so in any reasonable manner, but not in any way that suggests the licensor endorses you or your use.
- share alike – If you remix, transform, or build upon the material, you must distribute your contributions under the same or compatible license as the original.
Original upload log
This image is a derivative work of the following images:
-
File:West_Germany_1956-1990.svg
licensed with Cc-by-sa-3.0
- 2011-11-26T00:39:04Z StalwartUK 450x456 (485146 Bytes) == {{int:filedesc}} == {{Information |Description={{en|Map of [[:en:West Germany|West Germany]] (Federal Republic of Germany) as it was from 1949-1990. Surrounding countries accurate from 1956-1990.}} |Source=*[[:File:Blank_m
Uploaded with derivativeFX