European_genetic_structure_(based_on_SNPs)_PC_analysis.png

Size of this preview:
799 × 600 pixels
.
Other resolutions:
320 × 240 pixels
|
639 × 480 pixels
|
1,023 × 768 pixels
|
1,280 × 961 pixels
|
2,067 × 1,552 pixels
.
Summary
| Description |
English:
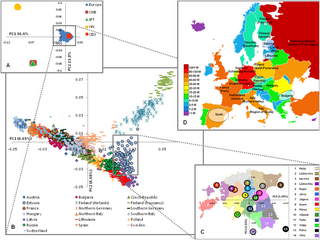
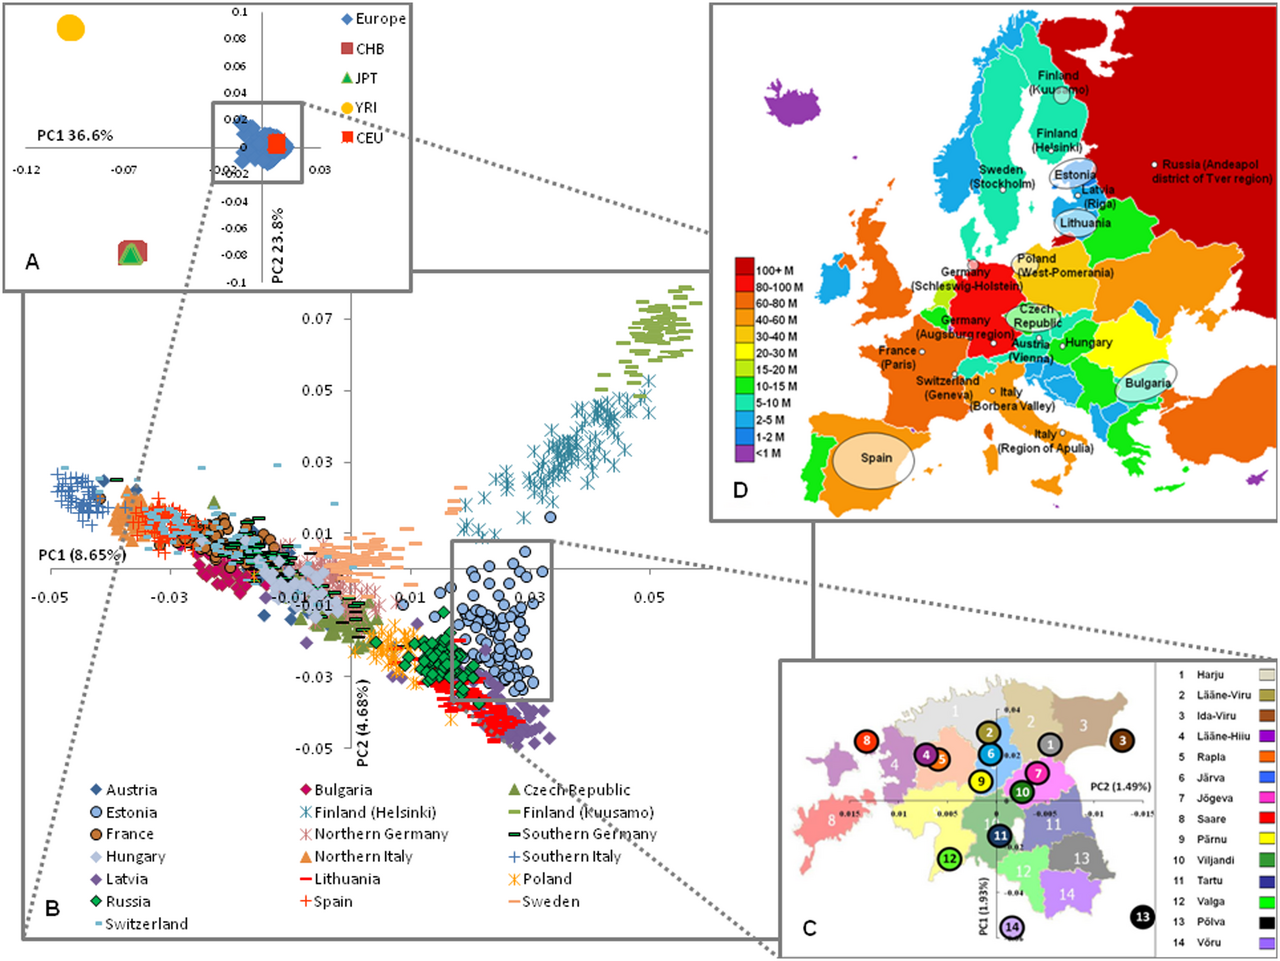
The European genetic structure (based on 273,464 SNPs). Three levels of structure as revealed by PC analysis are shown: A) inter-continental; B) intra-continental; and C) inside a single country (Estonia), where median values of the PC1&2 are shown. D) European map illustrating the origin of sample and population size. CEU - Utah residents with ancestry from Northern and Western Europe, CHB – Han Chinese from Beijing, JPT - Japanese from Tokyo, and YRI - Yoruba from Ibadan, Nigeria.
|
| Date | Published: 2009-05-08. Uploaded to Wikimedia Commons: 2012-03-05 |
| Source | Nelis M, Esko T, Mägi R, Zimprich F, Zimprich A, Toncheva D, et al. (2009) Genetic Structure of Europeans: A View from the North–East. PLoS ONE 4(5): e5472. doi:10.1371/journal.pone.0005472 http://journals.plos.org/plosone/article?id=10.1371/journal.pone.0005472 |
| Author | Nelis M, Esko T, Ma¨gi R, Zimprich F, Zimprich A, et al. (2009) |
|
Permission
( Reusing this file ) |
This image was published in a Public Library of Science journal. Their website states that the content of all PLoS journals is published under the Creative Commons Attribution 2.5 license. |
| Other versions |


|
Licensing
|
This file is licensed under the
Creative Commons
Attribution 2.5 Generic
license.
|
|
This file was published in a
Public Library of Science
journal.
Their website
states
that the content of all PLOS journals is published under the Creative Commons Attribution 4.0 license (or its previous version depending on the publication date), unless indicated otherwise.
|