Global_cumulative_human_impact_on_the_ocean.png

Size of this preview:
800 × 384 pixels
.
Other resolutions:
320 × 154 pixels
|
971 × 466 pixels
.
Summary
| Description |
English:
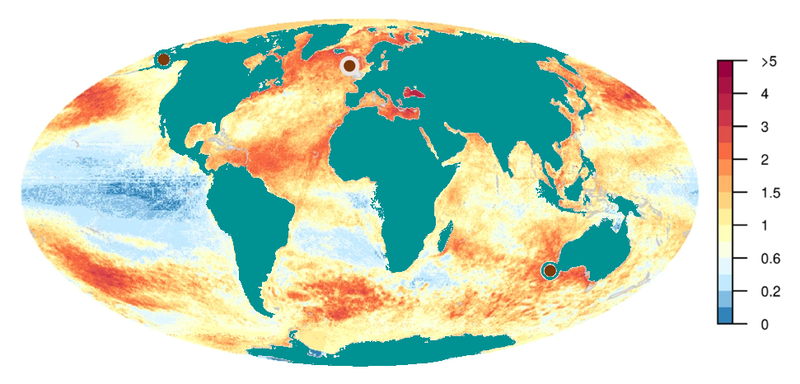
Global cumulative human impact on the ocean: Global patterns of cumulative human impacts.. Static map of 2013 CHI. (C) Coastal areas displayed for both pace of change and 2013 CHI for regions (indicated by dots on global CHI map) with dominant patterns of: high CHI, fast increasing pace of change (Southwestern Australia); high CHI, decreasing (North Sea); and low CHI, decreasing (Yukon Delta region of Alaska). There were no clear examples of low CHI, fast increasing
|
| Date | |
| Source | [1] |
| Author | Benjamin S. Halpern, Melanie Frazier, Jamie Afflerbach, Julia S. Lowndes, Fiorenza Micheli, Casey O’Hara, Courtney Scarborough & Kimberly A. Selkoe |
Licensing
This file is licensed under the
Creative Commons
Attribution 4.0 International
license.
-
You are free:
- to share – to copy, distribute and transmit the work
- to remix – to adapt the work
-
Under the following conditions:
- attribution – You must give appropriate credit, provide a link to the license, and indicate if changes were made. You may do so in any reasonable manner, but not in any way that suggests the licensor endorses you or your use.