Graph_charting_income_per_capita_throughout_the_Great_Depression.svg

Size of this PNG preview of this SVG file:
800 × 529 pixels
.
Other resolutions:
320 × 212 pixels
|
640 × 423 pixels
|
1,024 × 677 pixels
|
1,280 × 846 pixels
|
2,560 × 1,693 pixels
|
847 × 560 pixels
.
Summary
| Description |
English:
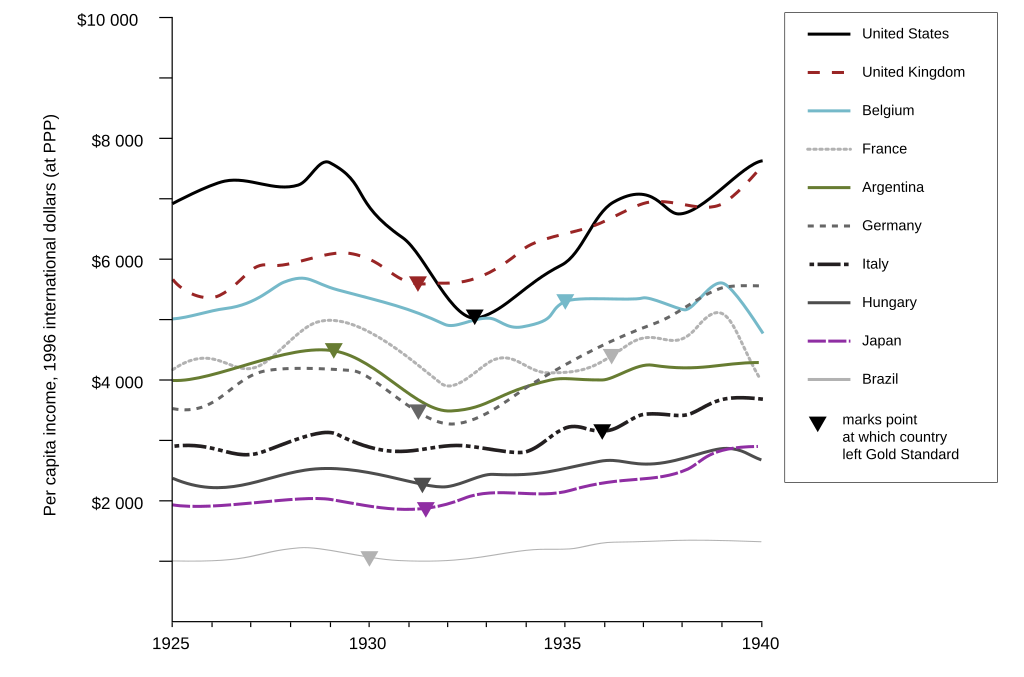
The Great Depression in an international perspective. Triangles mark points at which nations suspended gold convertibility and/or devalued their currency against gold. For full explanation and sources see prout
The Great Depression in Facts and Figures
.
العربية:
الكساد الكبير من منظور دولي. تشير علامات المثلثات إلى تواريخ التي علّقت فيها الدول
قاعدة الذهب
و/أو خفضت قيمة عملتها مقابل الذهب. للحصول على شرح كامل ومصادر انظر بروت
الكساد الكبير fالحقائق والأرقام
.
|
| Date | |
| Source | File:International_depression.png |
| Author |
|
| Other versions |

|
Licensing
This file is licensed under the
Creative Commons
Attribution-Share Alike 3.0 Unported
license.
-
You are free:
- to share – to copy, distribute and transmit the work
- to remix – to adapt the work
-
Under the following conditions:
- attribution – You must give appropriate credit, provide a link to the license, and indicate if changes were made. You may do so in any reasonable manner, but not in any way that suggests the licensor endorses you or your use.
- share alike – If you remix, transform, or build upon the material, you must distribute your contributions under the same or compatible license as the original.
