Harmonic_oscillator_gain.svg

Size of this PNG preview of this SVG file:
800 × 600 pixels
.
Other resolutions:
320 × 240 pixels
|
640 × 480 pixels
|
1,024 × 768 pixels
|
1,280 × 960 pixels
|
2,560 × 1,920 pixels
.
Summary
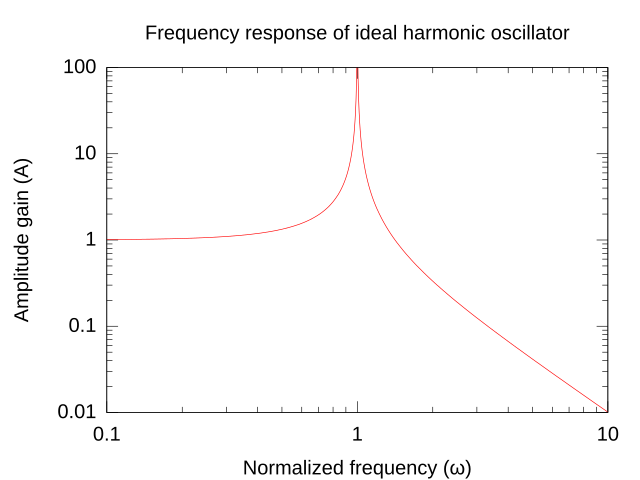
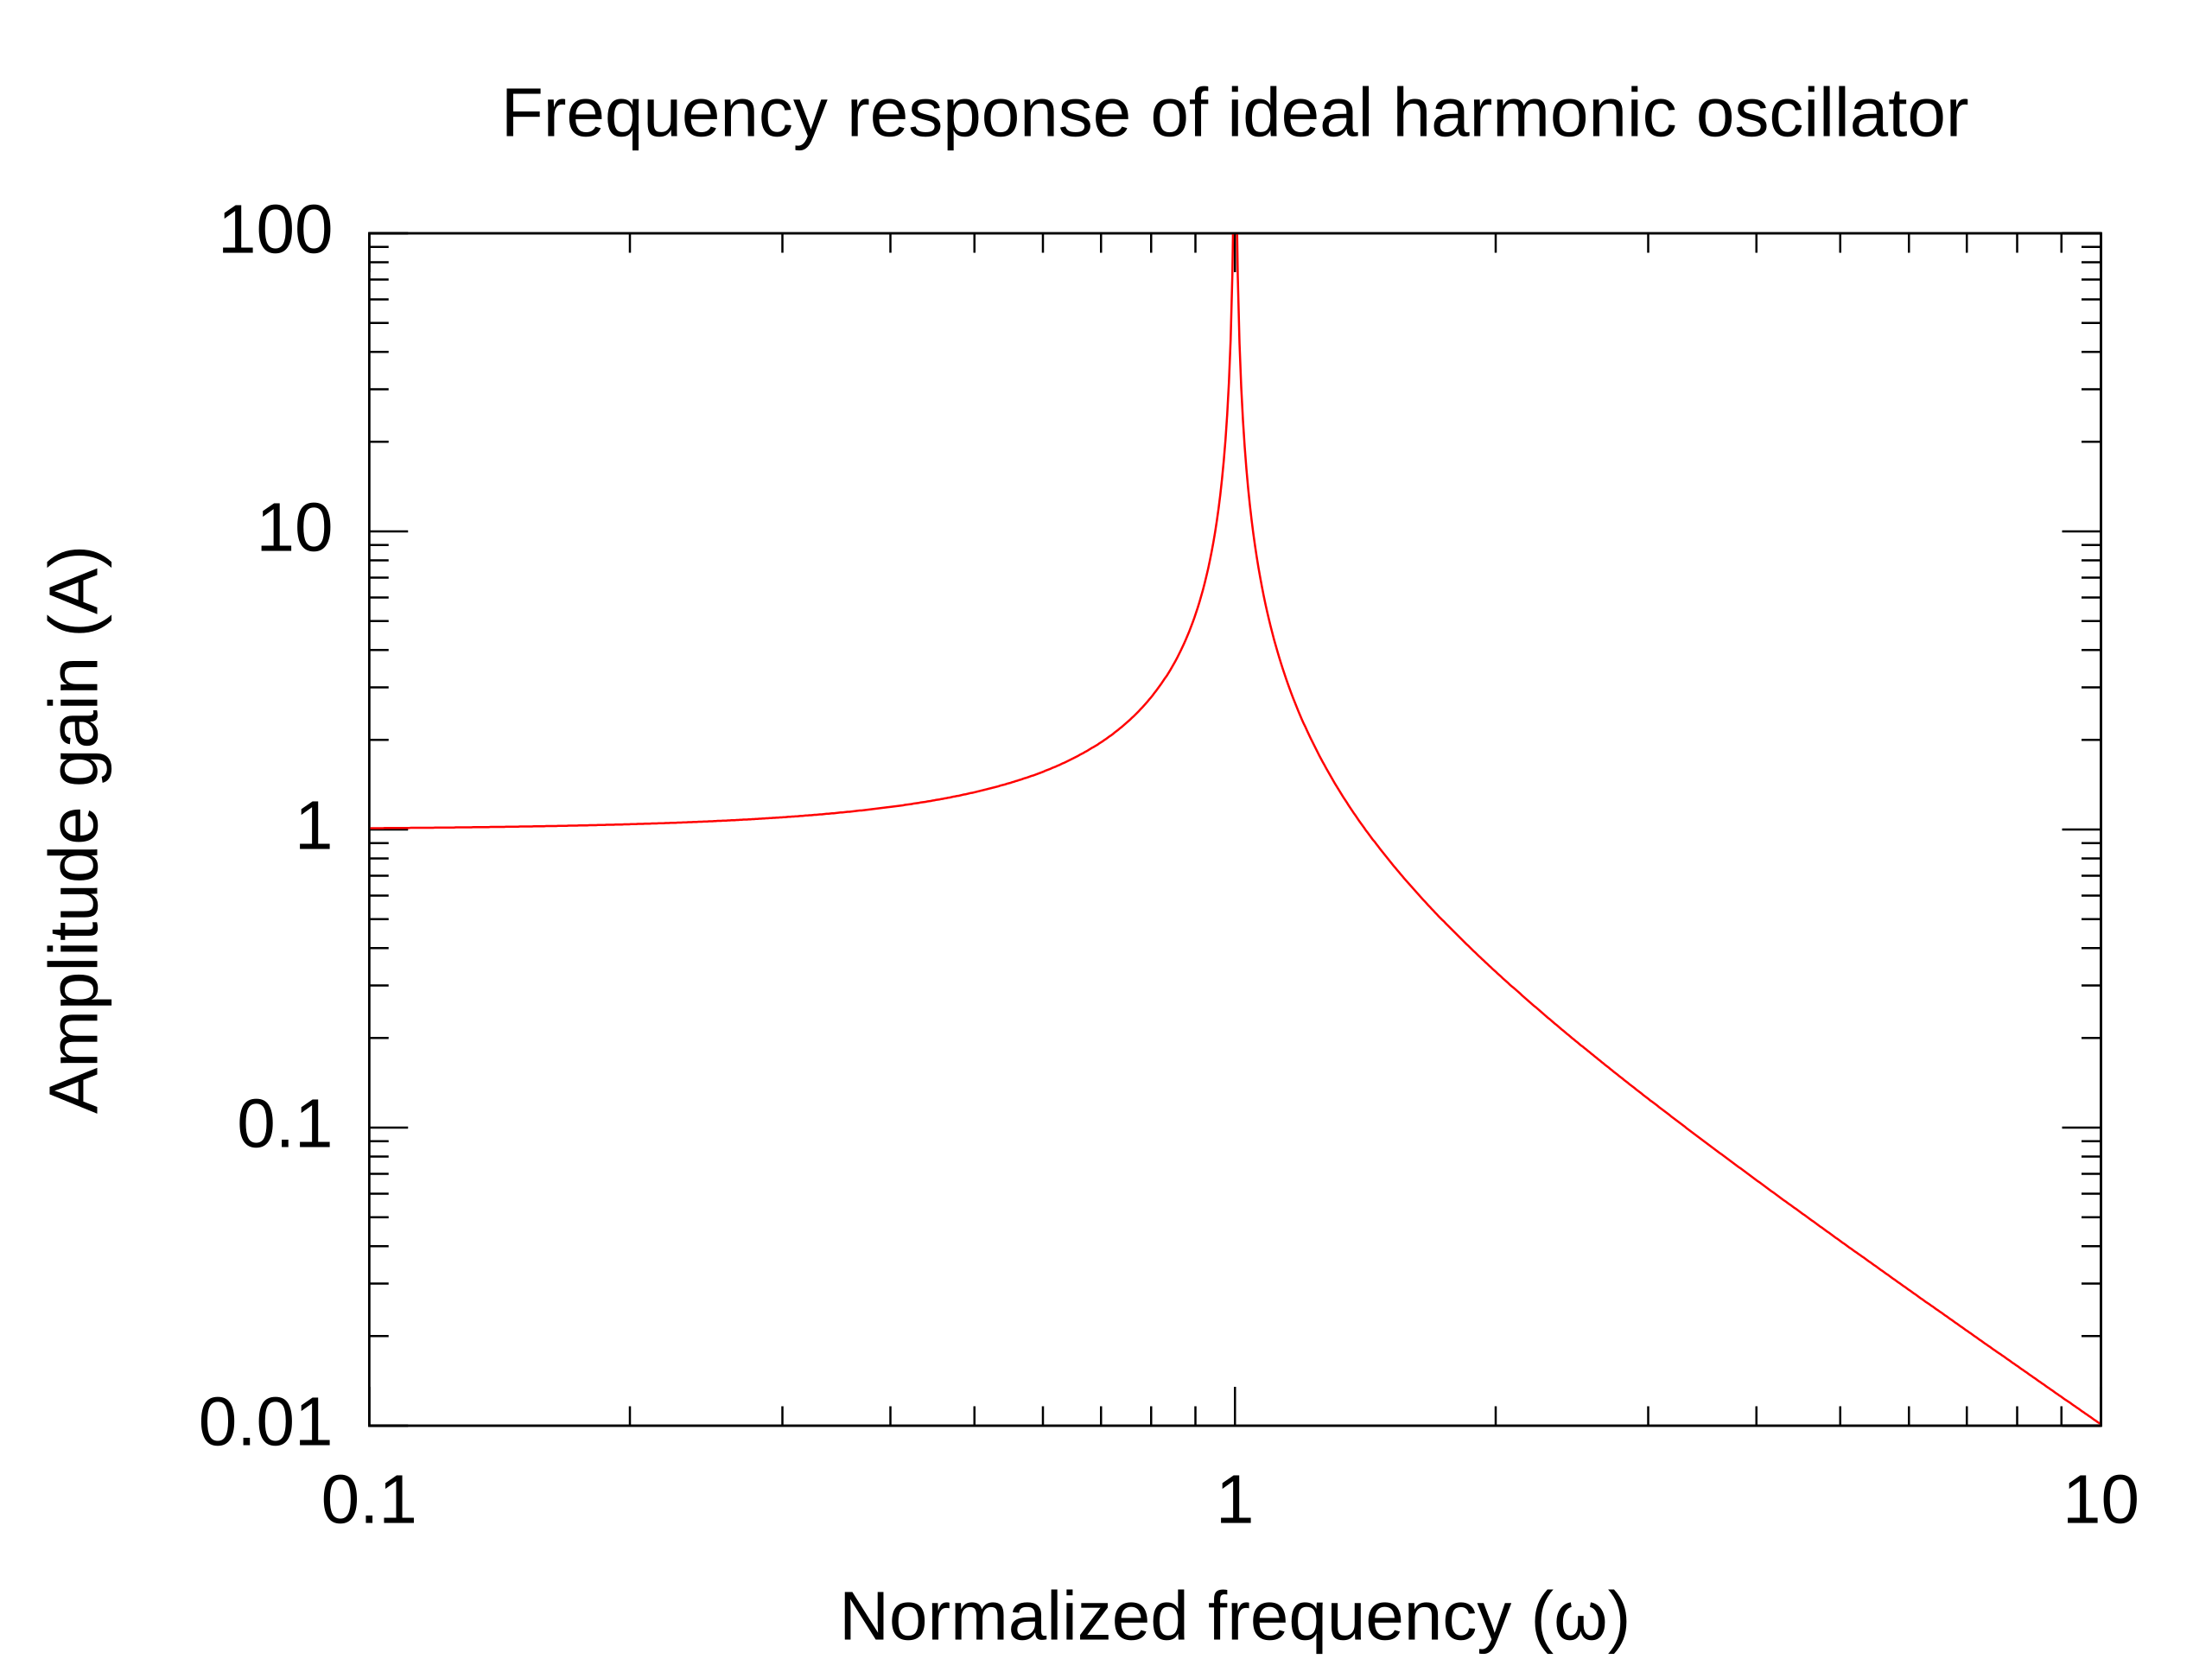
| Description | Log-log plot of the frequency response of an ideal harmonic oscillator, made with Gnuplot. The three sections of the graph can be understood as follows: Below resonance, the gain is approximately one, because the oscillator simply follows the driving force, neither amplifying nor attenuating it. Near resonance, the energy builds up inside the oscillator and the gain reaches a maximum (in a real oscillator, the height and sharpness of the peak are limited by the Q factor ). At higher frequencies, the oscillator cannot "keep up with" the rapidly varying driving force, so the signal is attenuated more and more (and also shifted 180 degrees out of phase). |
| Date | |
| Source | Own work |
| Author | Keenan Pepper |
Licensing
|
|
I, the copyright holder of this work, release this work into the
public domain
. This applies worldwide.
In some countries this may not be legally possible; if so: I grant anyone the right to use this work for any purpose , without any conditions, unless such conditions are required by law. |