Map_of_gene_flow_in_and_out_of_Beringia.jpg

Size of this preview:
480 × 599 pixels
.
Other resolutions:
192 × 240 pixels
|
384 × 480 pixels
|
708 × 884 pixels
.

|
This
map
image could be re-created
using
vector graphics
as an
SVG
file
. This has several advantages; see
Commons:Media for cleanup
for more information. If an SVG form of this image is available, please upload it and afterwards replace this template with
{{

vector version available

|

new image name

}}
.
It is recommended to name the SVG file “Map of gene flow in and out of Beringia.svg”—then the template Vector version available (or Vva ) does not need the new image name parameter. |


Summary
| Description |
English:
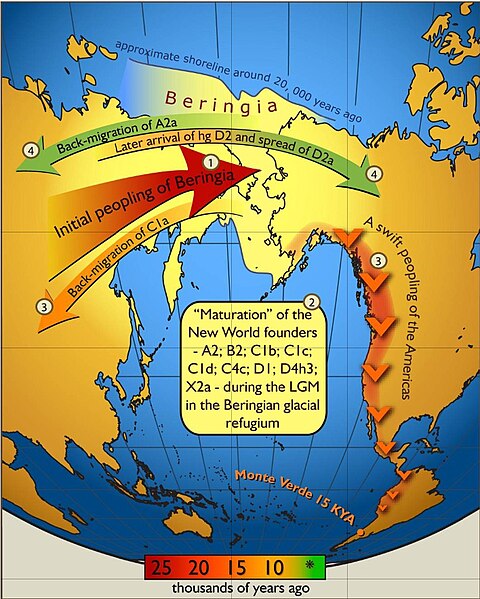
Map of gene flow in and out of Beringia, according to human mitochondrial DNA haplogroups.
Colors of the arrows correspond to approximate timing of the events and are decoded in the colored time bar. The initial peopling of Beringia (the region depicted in light yellow) was followed by a standstill after which the ancestors of the Native Americans spread swiftly all over the New World while some of the Beringian maternal lineages (C1a) spread westwards. More recent genetic exchange (shown in green) is manifested by back-migration of A2a into Siberia and the spread of D2a into north-eastern America that post-dated the initial peopling of the New World.
|
||
| Date | |||
| Source | Tamm E, Kivisild T, Reidla M, Metspalu M, Smith DG, et al. (2007) Beringian Standstill and Spread of Native American Founders. PLoS ONE 2(9): e829. doi:10.1371/journal.pone.0000829 . Also available from PubMed Central . | ||
| Author | Erika Tamm et al | ||
|
Permission
( Reusing this file ) |
|
Licensing
This file is licensed under the
Creative Commons
Attribution-Share Alike 3.0 Unported
license.
-
You are free:
- to share – to copy, distribute and transmit the work
- to remix – to adapt the work
-
Under the following conditions:
- attribution – You must give appropriate credit, provide a link to the license, and indicate if changes were made. You may do so in any reasonable manner, but not in any way that suggests the licensor endorses you or your use.
- share alike – If you remix, transform, or build upon the material, you must distribute your contributions under the same or compatible license as the original.
Original upload log
The original description page was
here
. All following user names refer to en.wikipedia.
- 2011-07-26 04:12 Pmsyyz 708×884× (242442 bytes) higher res
- 2010-08-24 16:26 Beao 422×527× (95805 bytes)
- 2009-08-31 19:41 Moxy 425×530× (70936 bytes) PUBLIC LIBRARY OF SCIENCE http://www.pubmedcentral.nih.gov/articlerender.fcgi?artid=1952074&rendertype=figure&id=pone-0000829-g002 The Public Library of Science (PLoS) applies the Creative Commons Attribution License (CCAL) to all works Schematic illus