Monthly_zonal_mean_precipitation.png

Size of this preview:
680 × 599 pixels
.
Other resolutions:
272 × 240 pixels
|
545 × 480 pixels
|
871 × 768 pixels
|
1,162 × 1,024 pixels
|
1,892 × 1,668 pixels
.
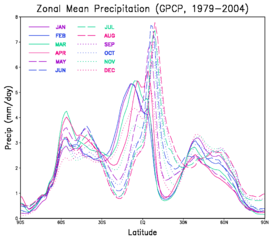
| Description | A graph showing the montly mean zonal precipitation as a function of latitude. |
| Date | (UTC) |
| Source | |
| Author |
|
|
|
This is a
retouched picture
, which means that it has been digitally altered from its original version. Modifications:
convert to png; crop
. The original can be viewed here:
Monthly zonal mean precipitation.gif
:
|
|
|
This file is in the public domain in the United States because it was solely created by NASA . NASA copyright policy states that "NASA material is not protected by copyright unless noted ". (See Template:PD-USGov , NASA copyright policy page or JPL Image Use Policy .) |
|

|
Warnings:
|
Original upload log
This image is a derivative work of the following images:
-
File:Monthly_zonal_mean_precipitation.gif
licensed with PD-USGov-NASA
- 2010-11-18T15:48:46Z Atmoz 2200x1700 (266511 Bytes) {{Information |Description=A graph showing the montly mean [[w:zonal|zonal]] [[w:precipitation|precipitation]] as a function of latitude. |Source=[http://gmao.gsfc.nasa.gov/research/merra/sci_archive/GPCP/plot_GP_zonal_all.gi
Uploaded with derivativeFX