Normal_distribution_and_scales.gif
Size of this preview:
800 × 458 pixels
.
Other resolutions:
320 × 183 pixels
|
640 × 366 pixels
|
1,200 × 687 pixels
.

|
File:The Normal Distribution.svg
is a vector version of this file. It should be used in place of this GIF file.
File:Normal distribution and scales.gif →
File:The Normal Distribution.svg
For more information, see
Help:SVG
.
|

|
Transferred from en.wikipedia to Commons by Maksim .
The original description page was
here
. All following user names refer to en.wikipedia.
Summary
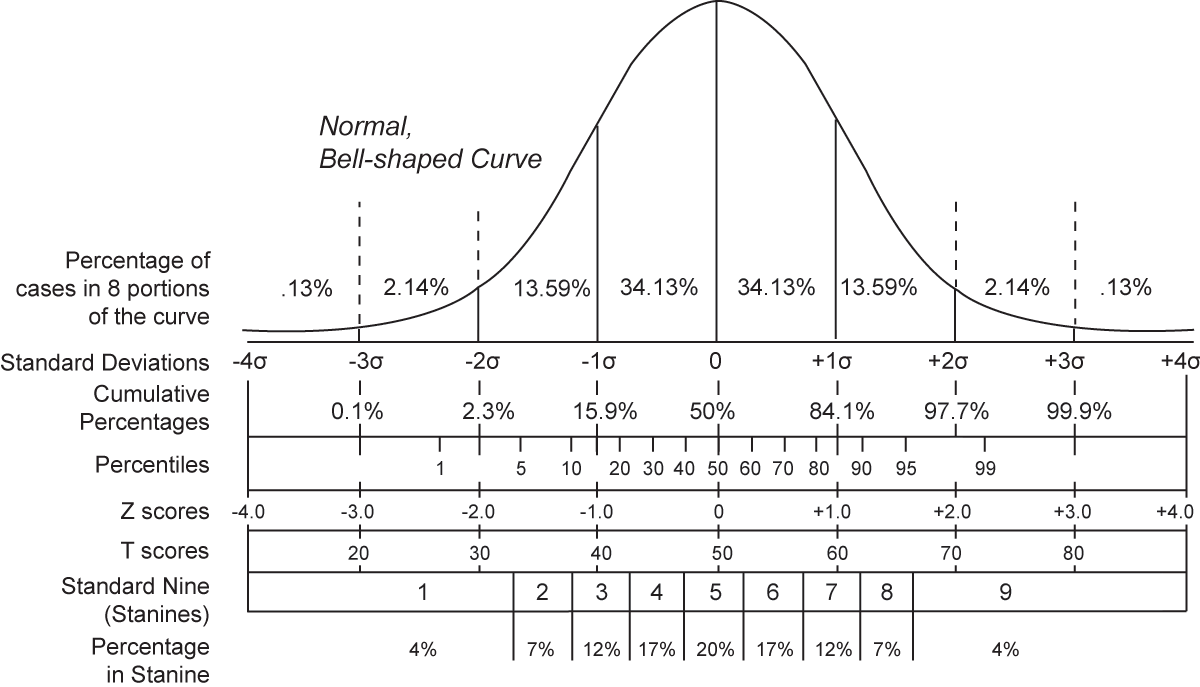
A chart comparing the various grading methods in a normal distribution. Includes: Standard deviations, cumulative percentages, percentile equivalents, Z-scores, T-scores, standard nine, percentage in stanine. Inspired by Figure 4.3 on Page 74 of Ward, A. W., Murray-Ward, M. (1999). Assessment in the Classroom. Belmont, CA: Wadsworth. ISBN 0534527043
Licensing
|
|
I, the copyright holder of this work, release this work into the
public domain
. This applies worldwide.
In some countries this may not be legally possible; if so: I grant anyone the right to use this work for any purpose , without any conditions, unless such conditions are required by law. |
| date/time | username | edit summary |
|---|---|---|
| 22:09, 19 December 2005 | en:User:Jeremykemp | (ISBN) |
| 22:01, 19 December 2005 | en:User:Jeremykemp | (added reference) |
| 21:53, 19 December 2005 | en:User:Jeremykemp | (A chart comparing the various grading methods in a normal distribution. Includes: Standard deviations, cummulative precentages, percentile equivalents, Z-scores, T-scores, standard nine, percent in stanine) |
Original upload log
Legend: (cur) = this is the current file, (del) = delete this old version, (rev) = revert to this old version.
Click on date to download the file or see the image uploaded on that date.
- (del) (cur) 21:53, 19 December 2005 . . en:User:Jeremykemp Jeremykemp ( en:User_talk:Jeremykemp Talk) . . 1200x687 (39575 bytes) (A chart comparing the various grading methods in a normal distribution. Includes: Standard deviations, cummulative precentages, percentile equivalents, Z-scores, T-scores, standard nine, percent in stanine)