North_Indian_Ocean_cyclone_tracks_1980-2005.jpg

Size of this preview:
800 × 533 pixels
.
Other resolutions:
320 × 213 pixels
|
640 × 427 pixels
|
1,024 × 683 pixels
|
1,280 × 853 pixels
|
2,560 × 1,707 pixels
|
3,300 × 2,200 pixels
.
Summary
| Description |
English:
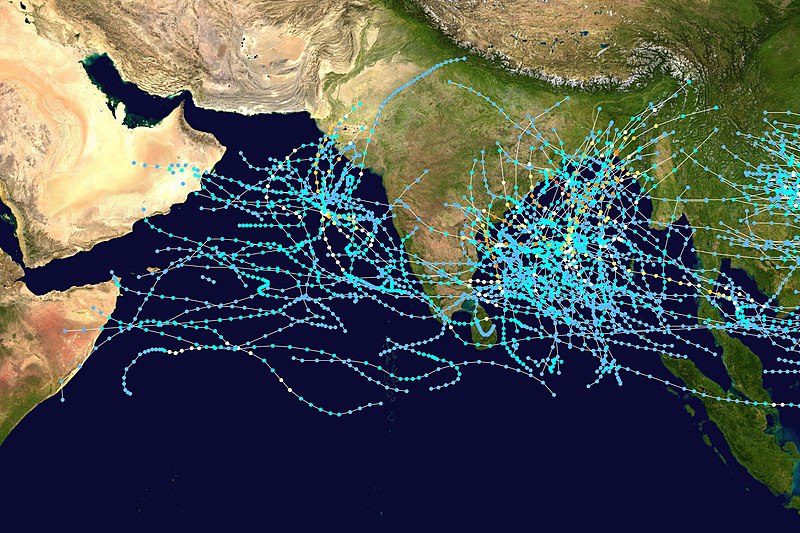
This map shows the tracks of all
tropical cyclones
monitored by the Joint Typhoon Warning Center in the North Indian Ocean from 1980 to 2005. The points show the locations of each storm at six-hour intervals. The colour represents the storm's
maximum sustained wind speeds
as classified in the Saffir-Simpson Hurricane Scale (see below), and the shape of the data points represent the nature of the storm.
Tropical depression (≤38 mph, ≤62 km/h)
Tropical storm (39–73 mph, 63–118 km/h)
Category 1 (74–95 mph, 119–153 km/h)
Category 2 (96–110 mph, 154–177 km/h)
Category 3 (111–129 mph, 178–208 km/h)
Category 4 (130–156 mph, 209–251 km/h)
Category 5 (≥157 mph, ≥252 km/h)
Unknown
Storm type |
| Date | October 10, 1980 – December 22, 2005 |
| Source | Created using Wikipedia:WikiProject Tropical cyclones/Tracks . The background image is from NASA [1] . The tracking data is from the Joint Typhoon Warning Center 's best track database for the North Indian Ocean |
| Author | Nilfanion |
Licensing
|
|
This work has been released into the
public domain
by its author,
Nilfanion
. This applies worldwide.
In some countries this may not be legally possible; if so: Nilfanion grants anyone the right to use this work for any purpose , without any conditions, unless such conditions are required by law. |