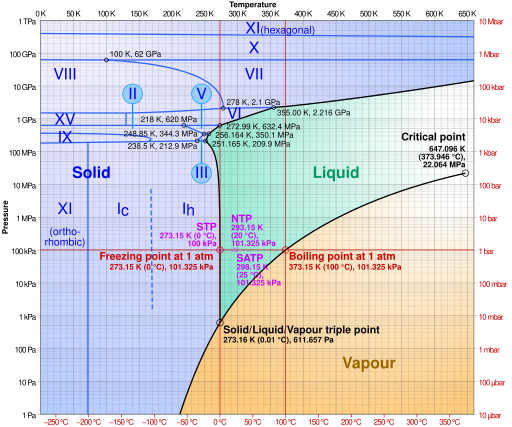
Phase_diagram_of_water.svg

Size of this PNG preview of this SVG file:
512 × 427 pixels
.
Other resolutions:
288 × 240 pixels
|
576 × 480 pixels
|
921 × 768 pixels
|
1,228 × 1,024 pixels
|
2,456 × 2,048 pixels
.
Summary
| Description | |||||||||||||
| Source | Own work | ||||||||||||
| Author | Cmglee | ||||||||||||
| Other versions |
Simplified version: File:Phase diagram of water simplified.svg Translations: Français • Polski • Español
File:
Phase diagram of water.svg
has
12 translations
.
|
||||||||||||
| SVG development |
This diagram was created with an unknown SVG tool.
This diagram is
translated using SVG
switch
elements
: all translations are stored in the same file.
|


Licensing
I, the copyright holder of this work, hereby publish it under the following license:
This file is licensed under the
Creative Commons
Attribution-Share Alike 3.0 Unported
license.
-
You are free:
- to share – to copy, distribute and transmit the work
- to remix – to adapt the work
-
Under the following conditions:
- attribution – You must give appropriate credit, provide a link to the license, and indicate if changes were made. You may do so in any reasonable manner, but not in any way that suggests the licensor endorses you or your use.
- share alike – If you remix, transform, or build upon the material, you must distribute your contributions under the same or compatible license as the original.