Phase_diagram_potassium_sodium_s_l.svg

Size of this PNG preview of this SVG file:
744 × 531 pixels
.
Other resolutions:
320 × 228 pixels
|
640 × 457 pixels
|
1,024 × 731 pixels
|
1,280 × 914 pixels
|
2,560 × 1,827 pixels
.
Summary
| Description |
English:
Phase diagram potassium sodium
Deutsch:
Phasendiagramm Kalium Natrium
Bahasa Indonesia:
Diagram fase kalium natrium
|
| Date | |
| Source | Own work |
| Author | Steffen 962 |
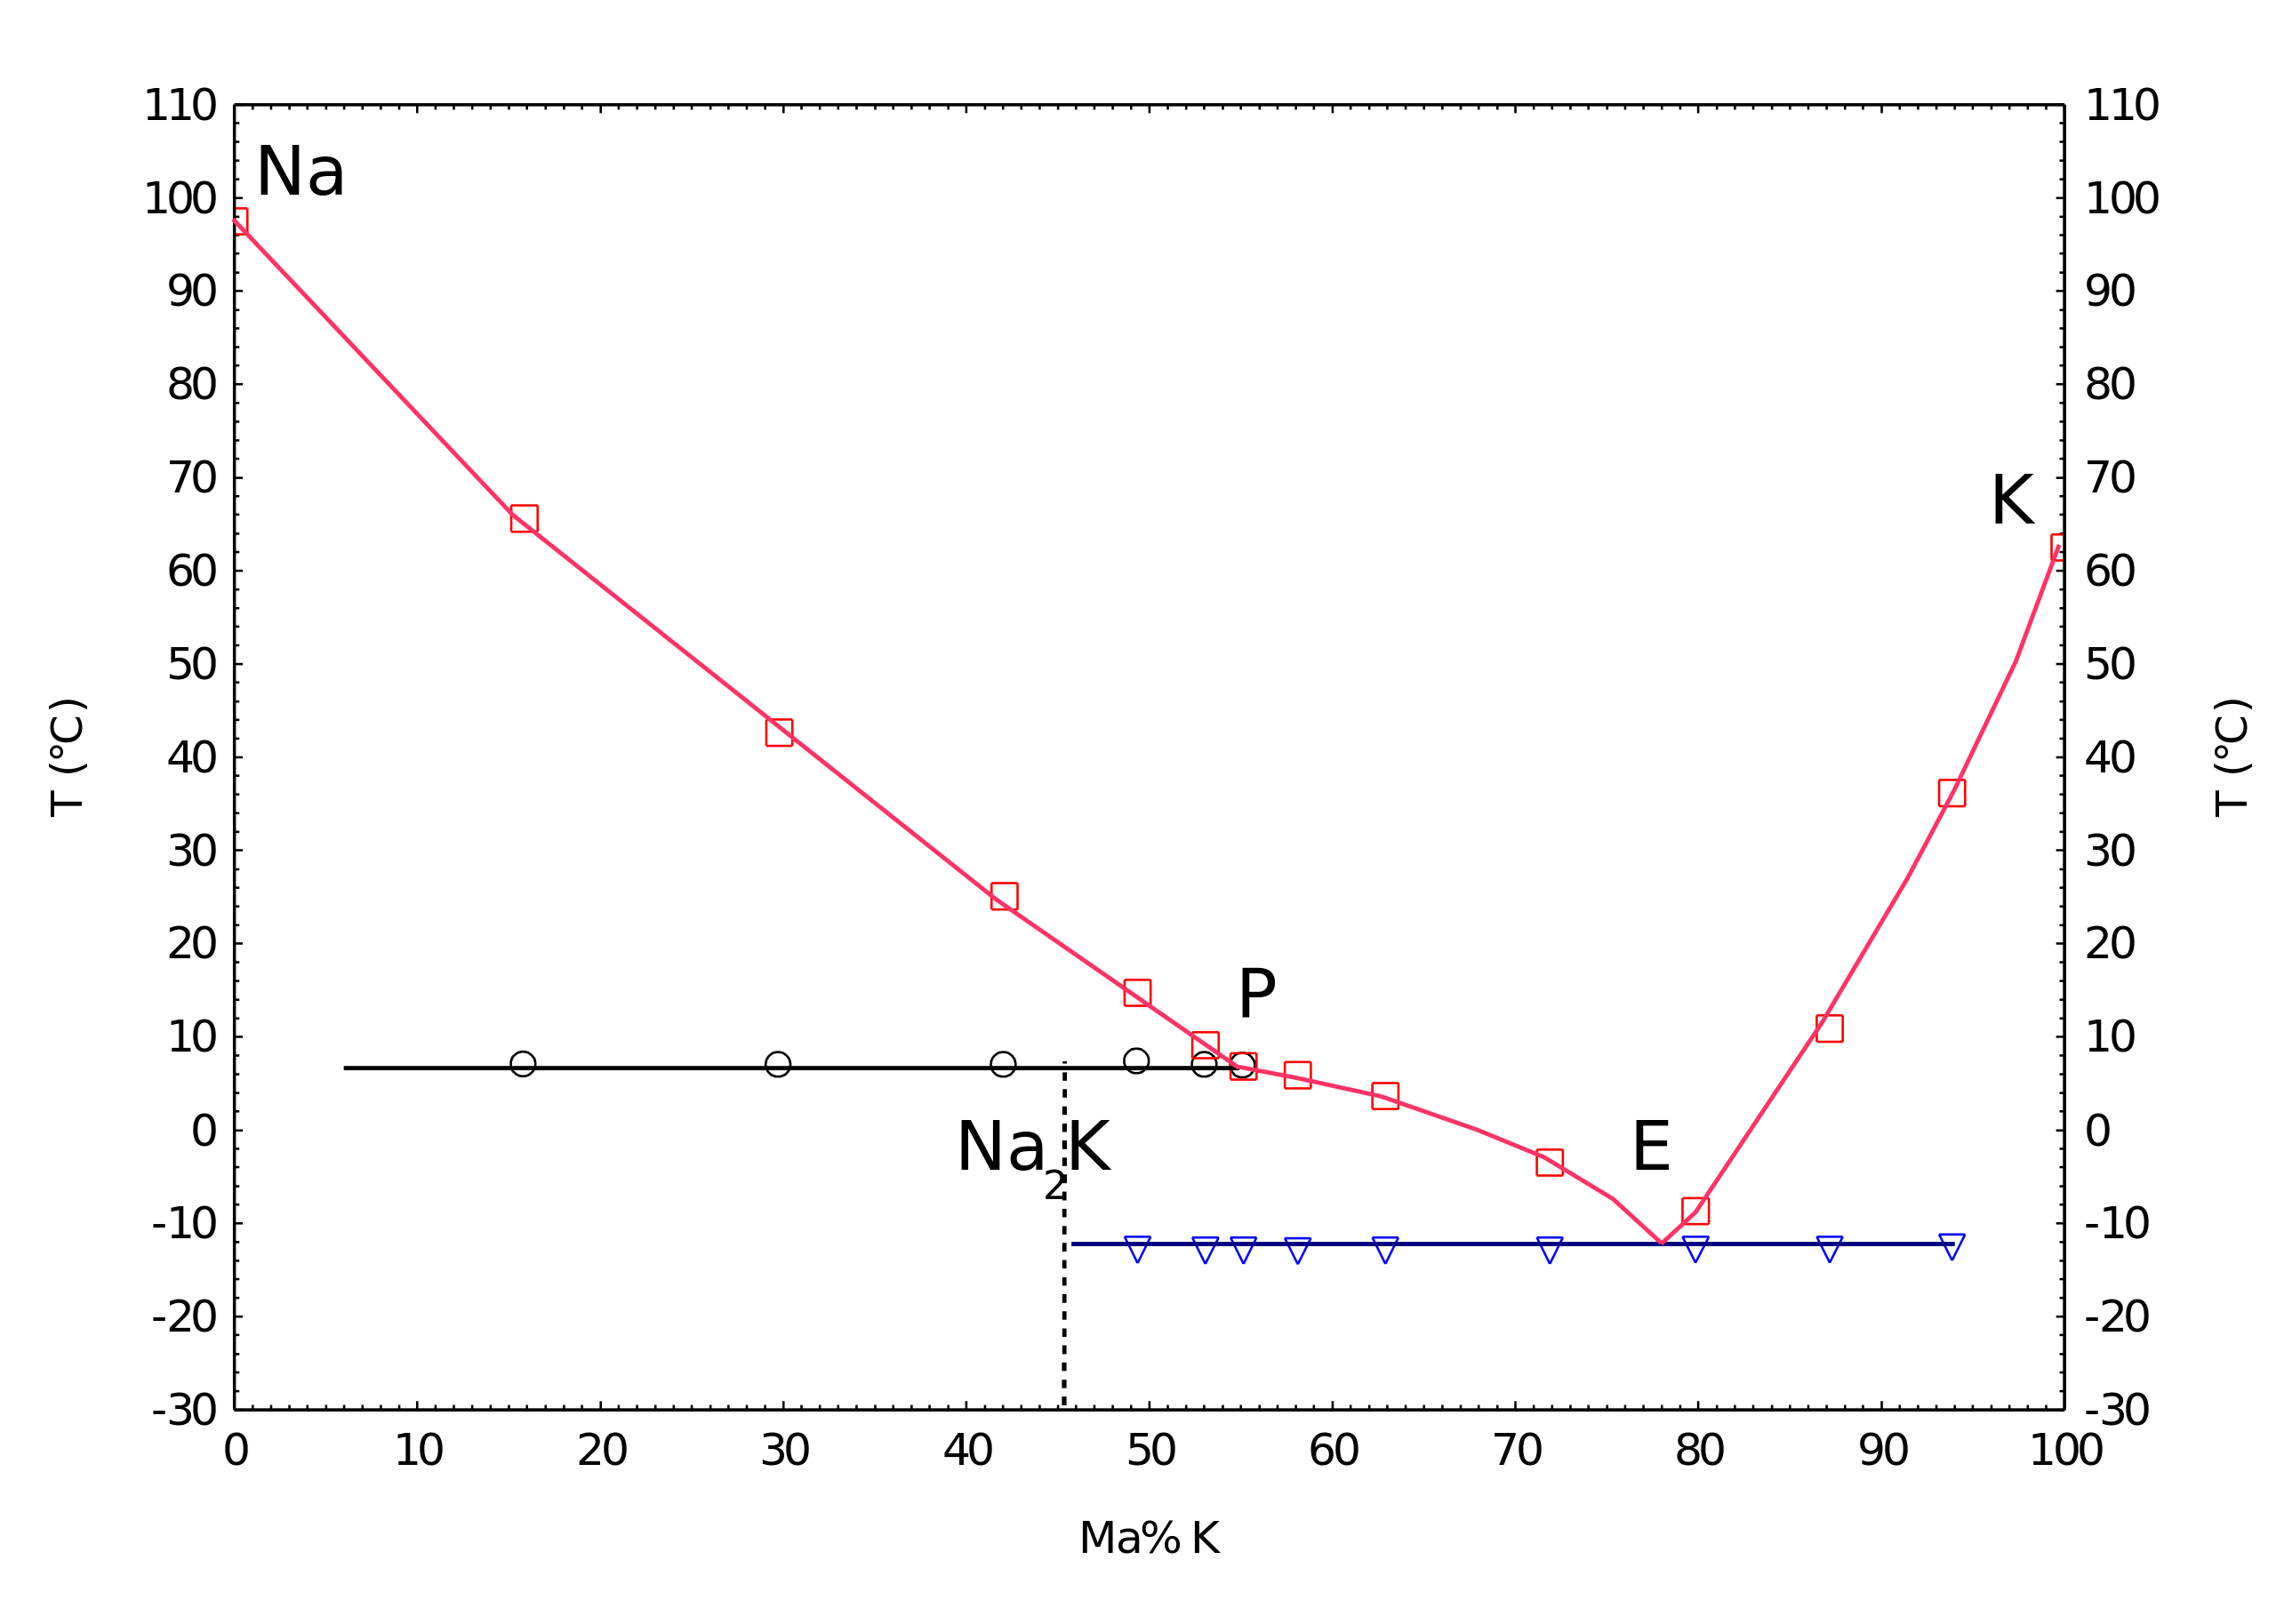
Daten aus / data from van Rossen, G.L.C.M.; van Bleiswijk, H.: Über das Zustandsdiagramm der Kalium-Natriumlegierungen in Z. Anorg. Chem. 74 (1912) 152-156
Legende: Na - Schmelzpunkt von reinem Natrium, K - Schmelzpunkt von reinem Kalium, E - Eutektikum, P - Peritektikum, blaue Linie - Schmelzpunkt der eutektischen Mischung, schwarze Linie - inkongruente Schmelze der Verbindung Na 2 K, rote Linie - Schmelze der Überschusskomponente
Legend: Na - melting point of pure sodium, K - melting point of pure potassium, E - eutectic point, P - peritectic point, blue line - melting point of eutectic mixture, black line - melting point of compound Na 2 K, red line - melting point of surplus
Licensing
|
|
I, the copyright holder of this work, release this work into the
public domain
. This applies worldwide.
In some countries this may not be legally possible; if so: I grant anyone the right to use this work for any purpose , without any conditions, unless such conditions are required by law. |