Poisson_pmf.svg

Size of this PNG preview of this SVG file:
330 × 255 pixels
.
Other resolutions:
311 × 240 pixels
|
621 × 480 pixels
|
994 × 768 pixels
|
1,280 × 989 pixels
|
2,560 × 1,978 pixels
.
Summary
| Description |
English:
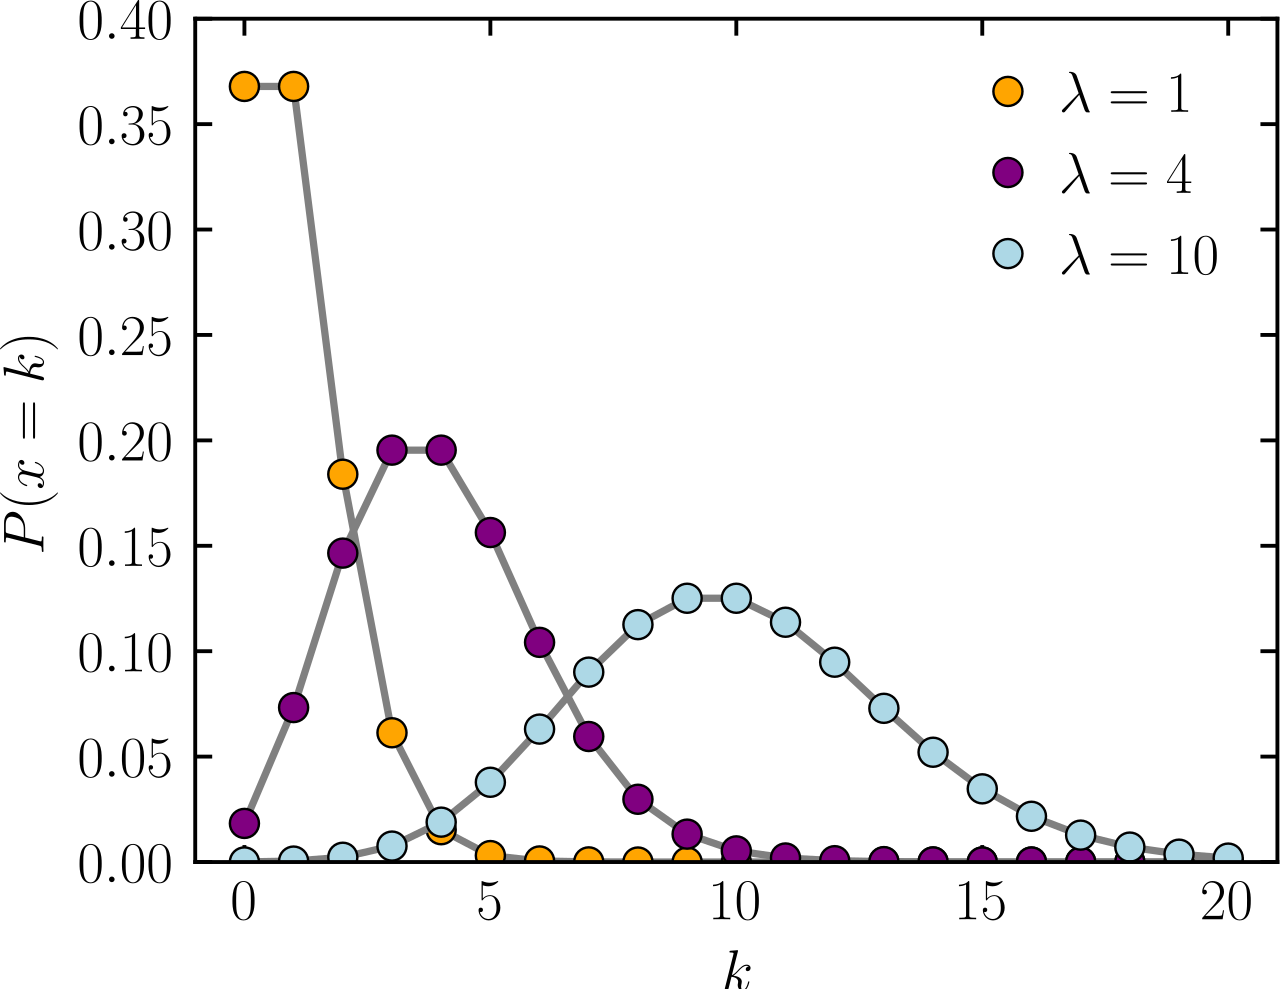
Plot of the probability mass function for the Poisson distribution.
|
| Date | |
| Source | Own work |
| Author | Skbkekas |
| SVG development |
This plot was created with
Matplotlib
.
|
| Source code |
Python codeimport numpy as np
import matplotlib.pyplot as plt
import scipy.special as sp
col = {1 : 'orange', 4: 'purple', 10: 'lightblue'}
X = np.arange(0, 21)
plt.rc('text', usetex = True)
plt.rc('font', family = 'serif', size = 12)
##
## PMF
##
plt.clf()
plt.figure(figsize=(4,3.2))
A = []
for L in 1,4,10:
P = -L + X*np.log(L) - sp.gammaln(X+1)
P = np.exp(P)
plt.plot(X, P, '-', color='grey', label='_nolegend_')
a = plt.plot(X, P, 'o', color=col[L], markeredgecolor='k', markeredgewidth=0.5)
A.append(a)
plt.xlabel("$k$")
plt.ylabel(r"$P(x=k)$")
plt.ylim([0,0.4])
plt.yticks(np.arange(0,0.42,.05))
plt.tick_params(direction='in', top=True, right=True)
plt.legend((r"$\lambda=1$", r"$\lambda=4$", r"$\lambda=10$"),
numpoints=1, handlelength=0.75, handletextpad=0.5,\
loc="upper right", frameon=False)
plt.xlim(-1,21)
plt.savefig("poisson_pmf.pdf")
plt.savefig("poisson_pmf.svg")
|
Licensing
I, the copyright holder of this work, hereby publish it under the following license:
This file is licensed under the
Creative Commons
Attribution 3.0 Unported
license.
-
You are free:
- to share – to copy, distribute and transmit the work
- to remix – to adapt the work
-
Under the following conditions:
- attribution – You must give appropriate credit, provide a link to the license, and indicate if changes were made. You may do so in any reasonable manner, but not in any way that suggests the licensor endorses you or your use.