San_Jose_Demographics_2010.jpg

Size of this preview:
600 × 600 pixels
.
Other resolutions:
240 × 240 pixels
|
480 × 480 pixels
|
768 × 768 pixels
|
1,024 × 1,024 pixels
.
Summary
| Description |
English:
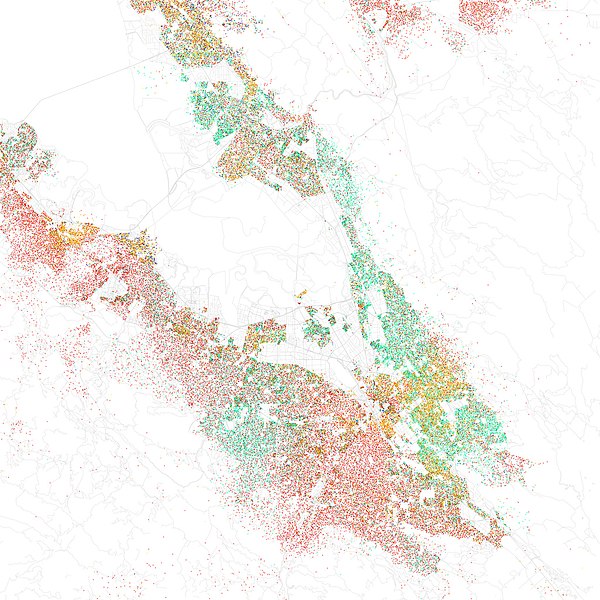
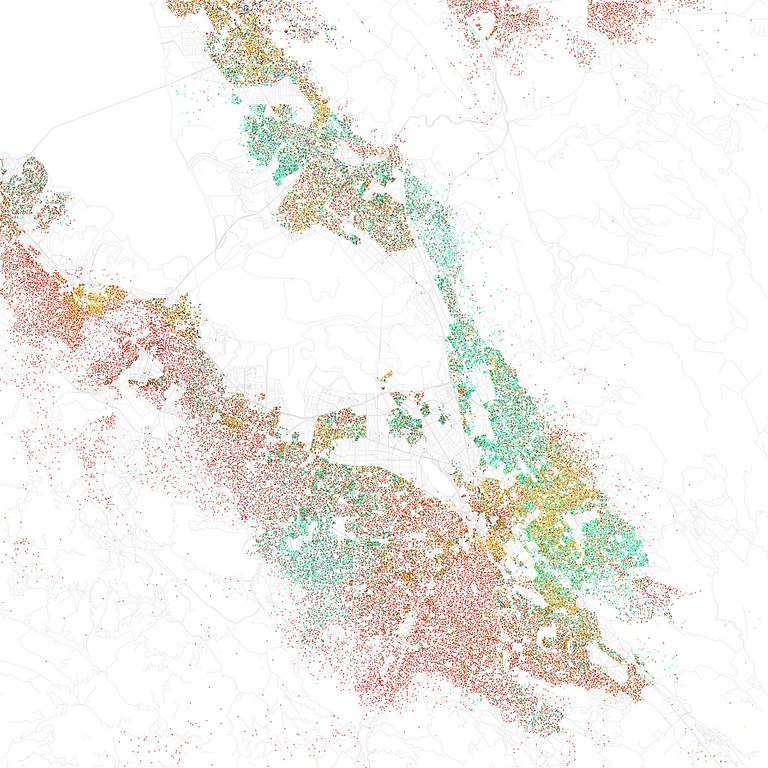
Maps of racial and ethnic divisions in US cities, inspired by Bill Rankin's map of Chicago, updated for Census 2010.
Red is White, Blue is Black, Green is Asian, Orange is Hispanic, Yellow is Other, and each dot is 25 residents. Data from Census 2010. Base map © OpenStreetMap, CC-BY-SA |
| Date | |
| Source | https://www.flickr.com/photos/walkingsf/5559901477/in/set-72157626354149574/ |
| Author | Eric Fischer |
Licensing
|
|
This image, originally posted to Flickr , was reviewed on 12 April 2012 by the administrator or reviewer Rjd0060 , who confirmed that it was available on Flickr under the stated license on that date. |
This file is licensed under the
Creative Commons
Attribution-Share Alike 2.0 Generic
license.
-
You are free:
- to share – to copy, distribute and transmit the work
- to remix – to adapt the work
-
Under the following conditions:
- attribution – You must give appropriate credit, provide a link to the license, and indicate if changes were made. You may do so in any reasonable manner, but not in any way that suggests the licensor endorses you or your use.
- share alike – If you remix, transform, or build upon the material, you must distribute your contributions under the same or compatible license as the original.
| Annotations | This image is annotated: View the annotations at Commons |