Sea_level_change_1993_to_2018.jpg

Size of this preview:
800 × 503 pixels
.
Other resolutions:
320 × 201 pixels
|
640 × 403 pixels
|
1,024 × 644 pixels
|
1,280 × 805 pixels
|
2,000 × 1,258 pixels
.
Summary
| Description |
English:
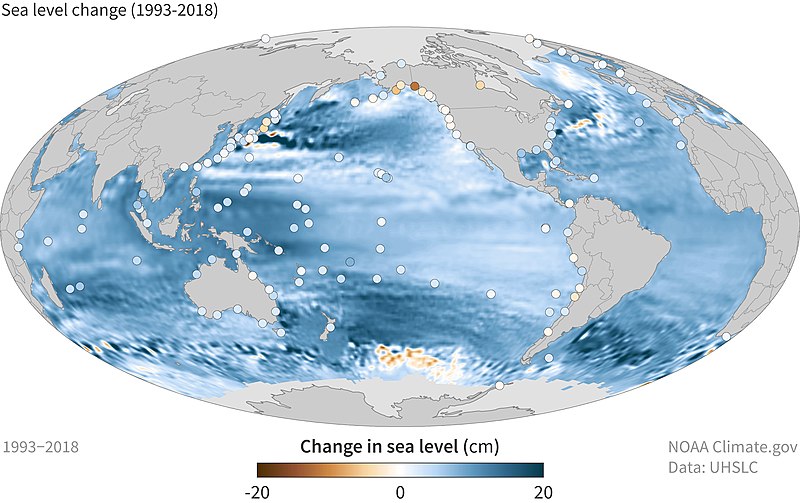
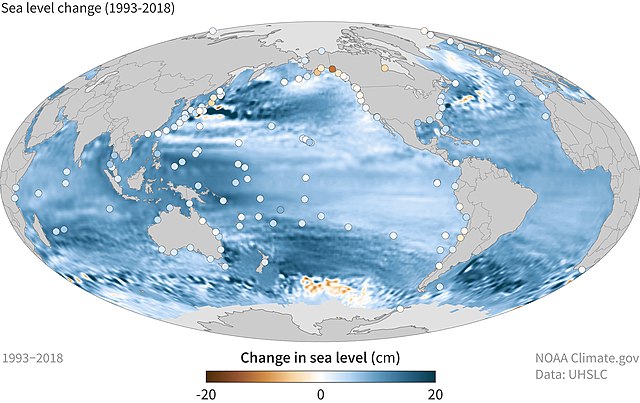
Between 1993 and 2018, mean sea level has risen across most of the world ocean (blue colors). In some ocean basins, sea level has risen 6-8 inches (15-20 centimeters). Rates of local sea level (dots) can be amplified by geological processes like ground settling or offset by processes like the centuries-long rebound of land masses from the loss of ice age glaciers. NOAA Climate.gov map, based on data provided by Philip Thompson, University of Hawaii.
|
| Date | |
| Source | NOAA |
| Author | NOAA |
Licensing
|
|
This work is in the
public domain
in the United States because it is a
work prepared by an officer or employee of the United States Government as part of that person’s official duties
under the terms of
Title 17, Chapter 1, Section 105
of the
US Code
.
Note
: This only applies to original works of the Federal Government and not to the work of any individual
U.S. state
,
territory
, commonwealth, county, municipality, or any other subdivision. This template also does not apply to postage stamp designs published by the
United States Postal Service
since 1978
. (See §
313.6(C)(1)
of Compendium of U.S. Copyright Office Practices). It also does not apply to certain US coins; see
The US Mint Terms of Use
.
|

|
| This file has been identified as being free of known restrictions under copyright law, including all related and neighboring rights. | ||