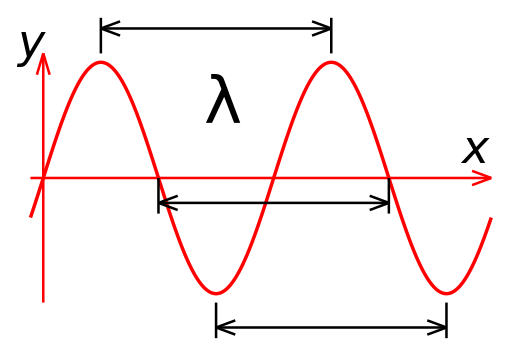
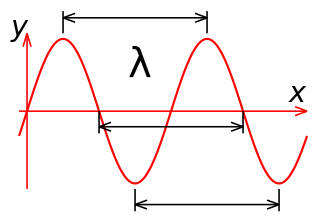
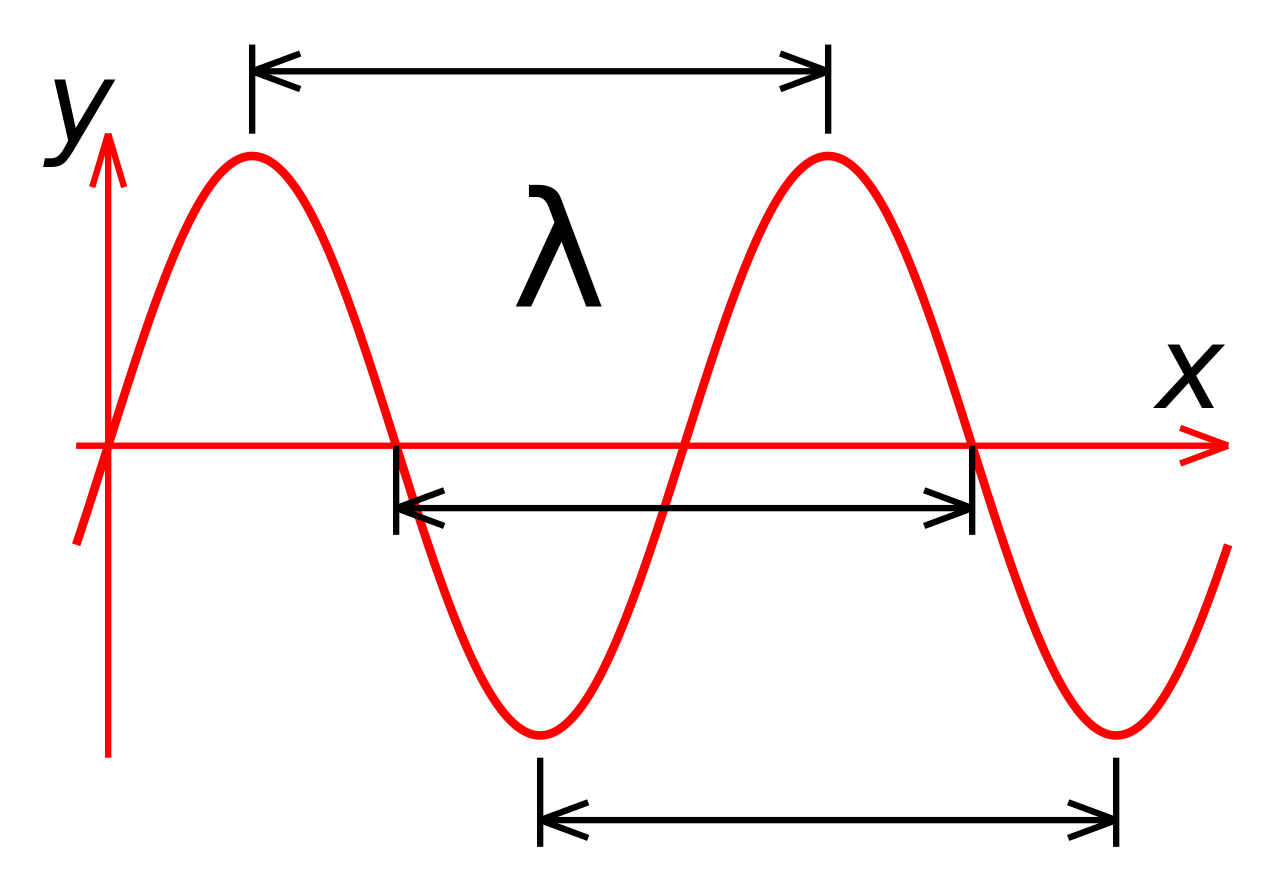
Sine_wavelength.svg

Size of this PNG preview of this SVG file:
512 × 356 pixels
.
Other resolutions:
320 × 223 pixels
|
640 × 445 pixels
|
1,024 × 712 pixels
|
1,280 × 890 pixels
|
2,560 × 1,780 pixels
.
Summary
| Description |
English:
Plot of a sine wave, showing three pairs of corresponding points between which wavelength (lambda) can be measured.
|
| Date | |
| Source | Own work |
| Author | Dicklyon (Richard F. Lyon) |
Licensing
I, the copyright holder of this work, hereby publish it under the following license:
This file is licensed under the
Creative Commons
Attribution-Share Alike 3.0 Unported
license.
-
You are free:
- to share – to copy, distribute and transmit the work
- to remix – to adapt the work
-
Under the following conditions:
- attribution – You must give appropriate credit, provide a link to the license, and indicate if changes were made. You may do so in any reasonable manner, but not in any way that suggests the licensor endorses you or your use.
- share alike – If you remix, transform, or build upon the material, you must distribute your contributions under the same or compatible license as the original.
Source ( Asymptote )
import graph;
size(200,100,IgnoreAspect);

real f(real x) {
  return sin(2*pi*x);
}

string fmt(real x) {
  return "";
}

draw(graph(f, 0, 2, operator..), red);
xaxis("$x$",Ticks(N=0,n=4,Step=0.5,ticklabel=fmt));
yaxis("$y(x)$",Ticks(N=0,n=4,Step=1, ticklabel=fmt));

Label lambda=Label("$\lambda$",align=N,blue);
draw(L=lambda, (0.25, 1) -- (1.25, 1), blue, Arrows);
draw(L=lambda, (0.50, 0) -- (1.50, 0), blue, Arrows);
draw(L=lambda, (0.75,-1) -- (1.75,-1), blue, Arrows);