Surexploitation_morue_surpêcheEn.jpg
Size of this preview:
765 × 599 pixels
.
Other resolutions:
306 × 240 pixels
|
613 × 480 pixels
|
942 × 738 pixels
.
Summary
| Description |
English:
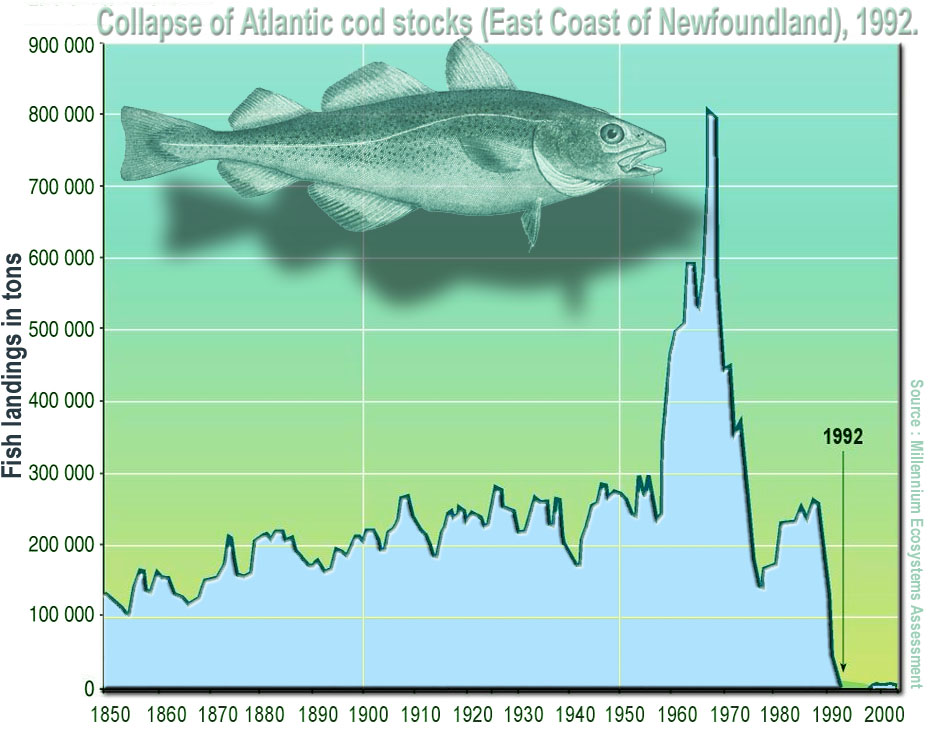
Collapse of Atlantic cod landings off the East Coast of Newfoundland in 1992. From the late 1950s, offshore bottom trawlers began exploiting the deeper part of the stock, leading to a large catch increase and a strong decline in the underlying biomass. Internationally agreed quotas in the early 1970s and, following the declaration by Canada of an Exclusive Fishing Zone in 1977, national quota systems ultimately failed to arrest and reverse the decline
Français :
Effondrement des stocks de
morue
de l'Atlantique au large de la côte Est de
Terre-Neuve
en 1992. Dès la fin des années 1950, des chalutiers de fond ont commencé à exploiter (surexploiter) la partie profonde de la zone, conduisant à une augmentation des prises et à une forte baisse de la biomasse sous-jacente. Les Quotas trop tardivement convenus au niveau international au début des années 1970, qui ont fait suite à la déclaration par le Canada d'une zone exclusive de pêche dans cette zone en 1977 ont finalement échoué à arrêter et inverser le déclin de ce stock halieutique
|
| Date | |
| Source | Own work |
| Author | Lamiot |
| Other versions | Derivative works of this file: Collapsio gadorum anno 1992.jpg |

|
This
graph
image could be re-created
using
vector graphics
as an
SVG
file
. This has several advantages; see
Commons:Media for cleanup
for more information. If an SVG form of this image is available, please upload it and afterwards replace this template with
{{

vector version available

|

new image name

}}
.
It is recommended to name the SVG file “Surexploitation morue surpêcheEn.svg”—then the template Vector version available (or Vva ) does not need the new image name parameter. |


Source : Millennium Ecosystems Assessment See also : Grida
Licensing
I, the copyright holder of this work, hereby publish it under the following licenses:

|
Permission is granted to copy, distribute and/or modify this document under the terms of the GNU Free Documentation License , Version 1.2 or any later version published by the Free Software Foundation ; with no Invariant Sections, no Front-Cover Texts, and no Back-Cover Texts. A copy of the license is included in the section entitled GNU Free Documentation License . |
This file is licensed under the
Creative Commons
Attribution-Share Alike
3.0 Unported
,
2.5 Generic
,
2.0 Generic
and
1.0 Generic
license.
-
You are free:
- to share – to copy, distribute and transmit the work
- to remix – to adapt the work
-
Under the following conditions:
- attribution – You must give appropriate credit, provide a link to the license, and indicate if changes were made. You may do so in any reasonable manner, but not in any way that suggests the licensor endorses you or your use.
- share alike – If you remix, transform, or build upon the material, you must distribute your contributions under the same or compatible license as the original.
You may select the license of your choice.