The_number_of_civil_servants_employed_in_the_UK_in_2013_is_448,840.png
Summary
| Description |
English:
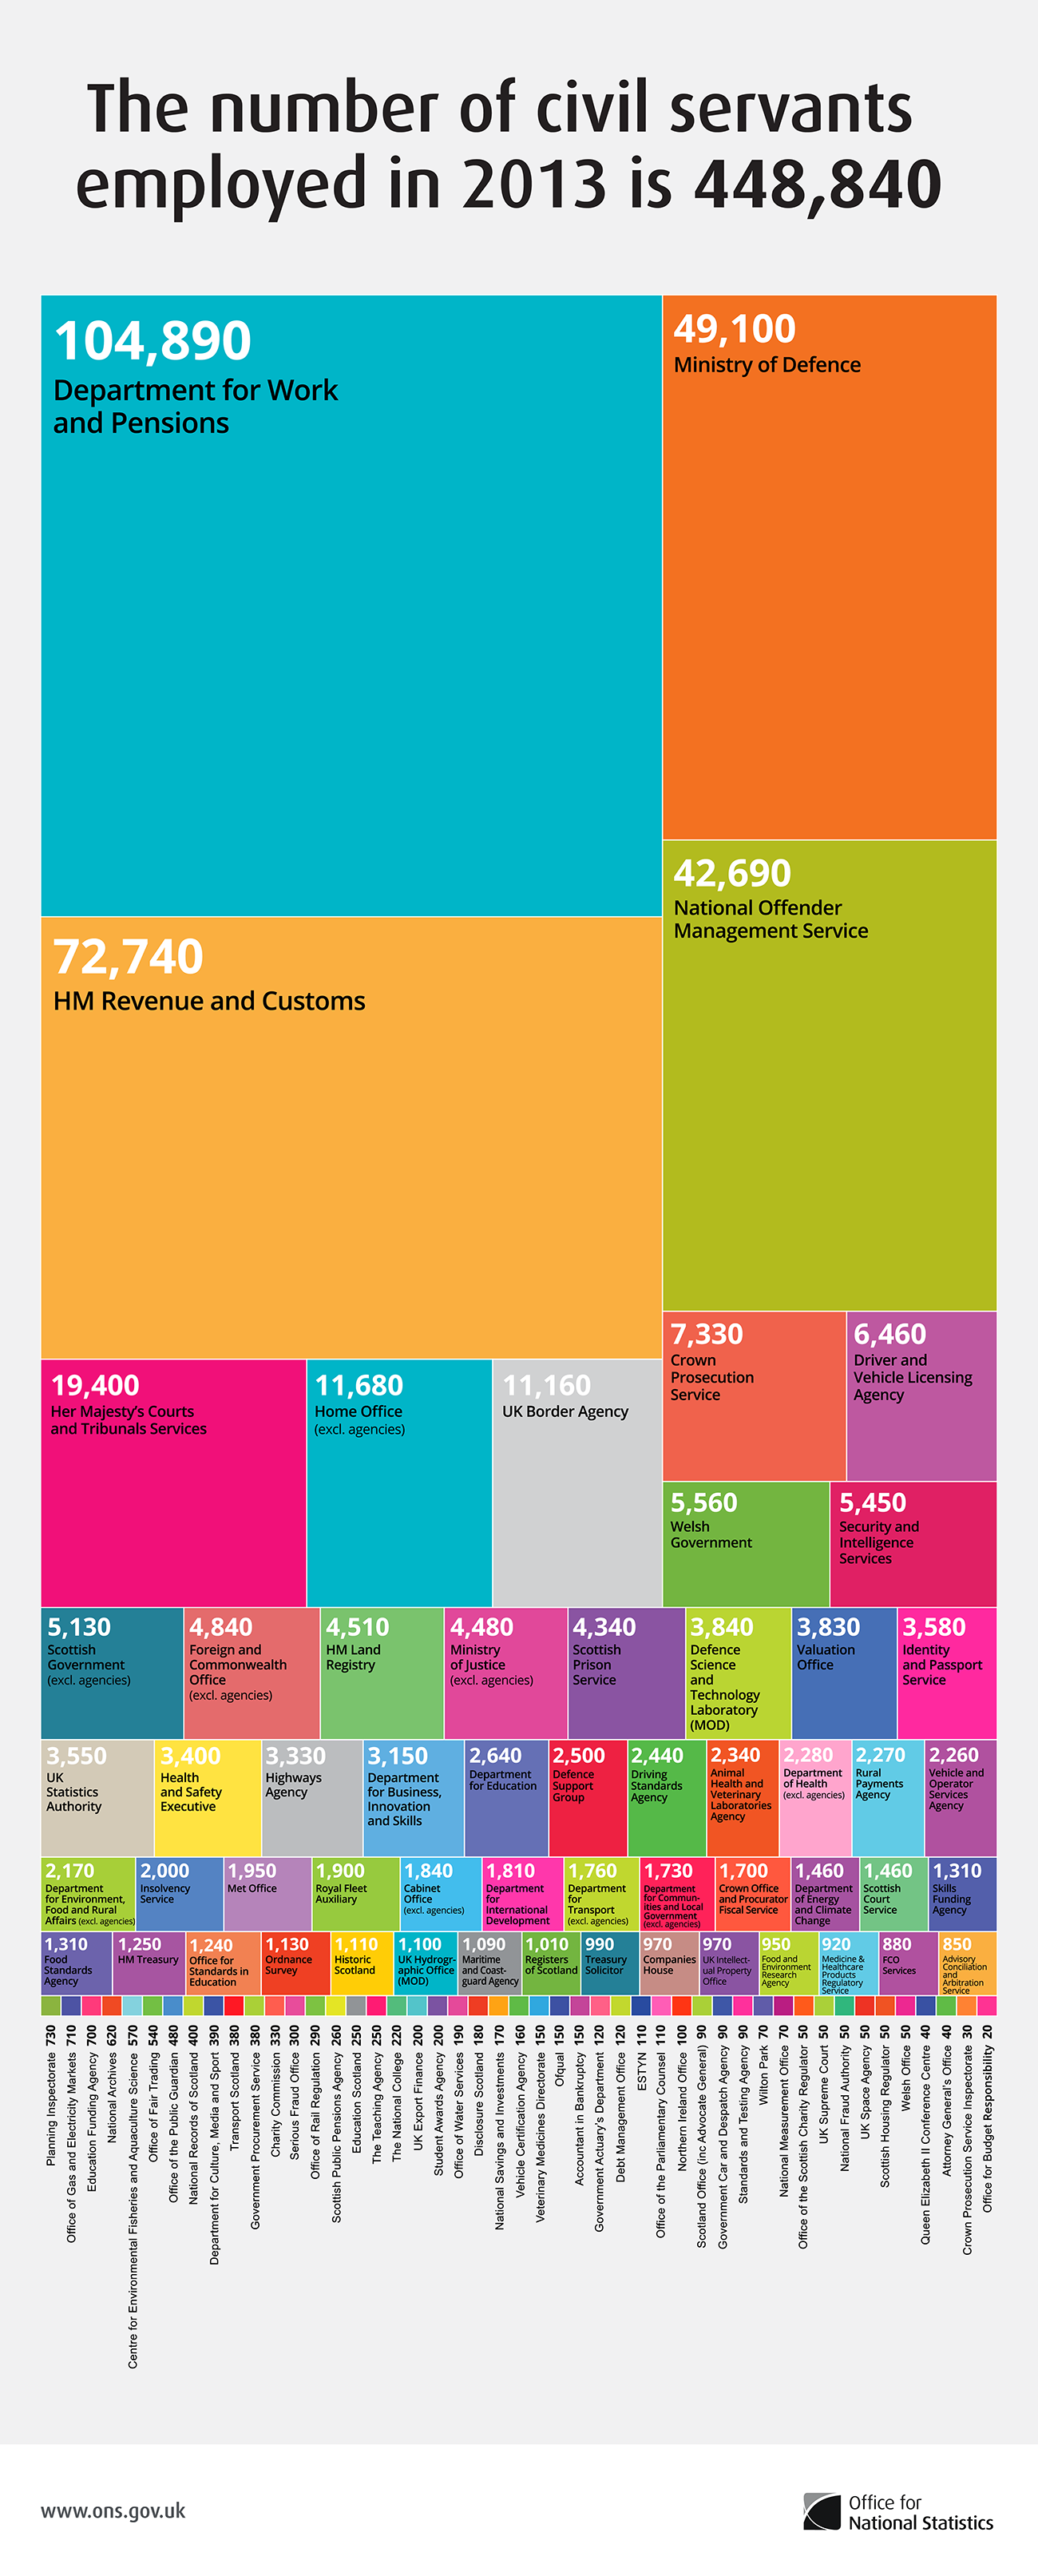
Civil Service Employment on 31 March 2013 was 448,835, down just under 15,000, or around 3 per cent, on 31 March 2012.
In terms of working patterns, the number of full-time civil servants fell by 14,205 to around 340,050 between March 2012 and March 2013. The number of civil servants working part-time fell by around 770 to 108,790. Females made up more than half (53 per cent) of all employees, the same as in 2012. However, over 90% of male civil servants were full time compared with less than two thirds of female civil servants. Of those employees who declared their ethnicity, 9.6 per cent were from an ethnic minority, up 0.3 per cent from 2012. Of those who declared their disability status, 8.6 were disabled, up 0.3 per cent from 2012. Median gross annual earnings (excluding over time or one-off bonuses) for Civil Service employees was £24,380 in March 2013, an increase of £480 (2 per cent) on March 2012. There continue to be more leavers from the Civil Service than entrants with almost twice as many leavers between March 2012 and March 2013 as entrants. |
| Date | |
| Source | |
| Author | Office for National Statistics |
Licensing
.svg)
|
This file is licensed under the
Open Government Licence version 1.0
(
OGL v1.0
).
|
|---|---|
|
You are free to:
See the Open Government Licence page on Meta-Wiki for more information.
|