Time_series_of_active_COVID-19_cases,_most_affected_countries.svg

Size of this PNG preview of this SVG file:
768 × 576 pixels
.
Other resolutions:
320 × 240 pixels
|
640 × 480 pixels
|
1,024 × 768 pixels
|
1,280 × 960 pixels
|
2,560 × 1,920 pixels
.
Summary
| Description |
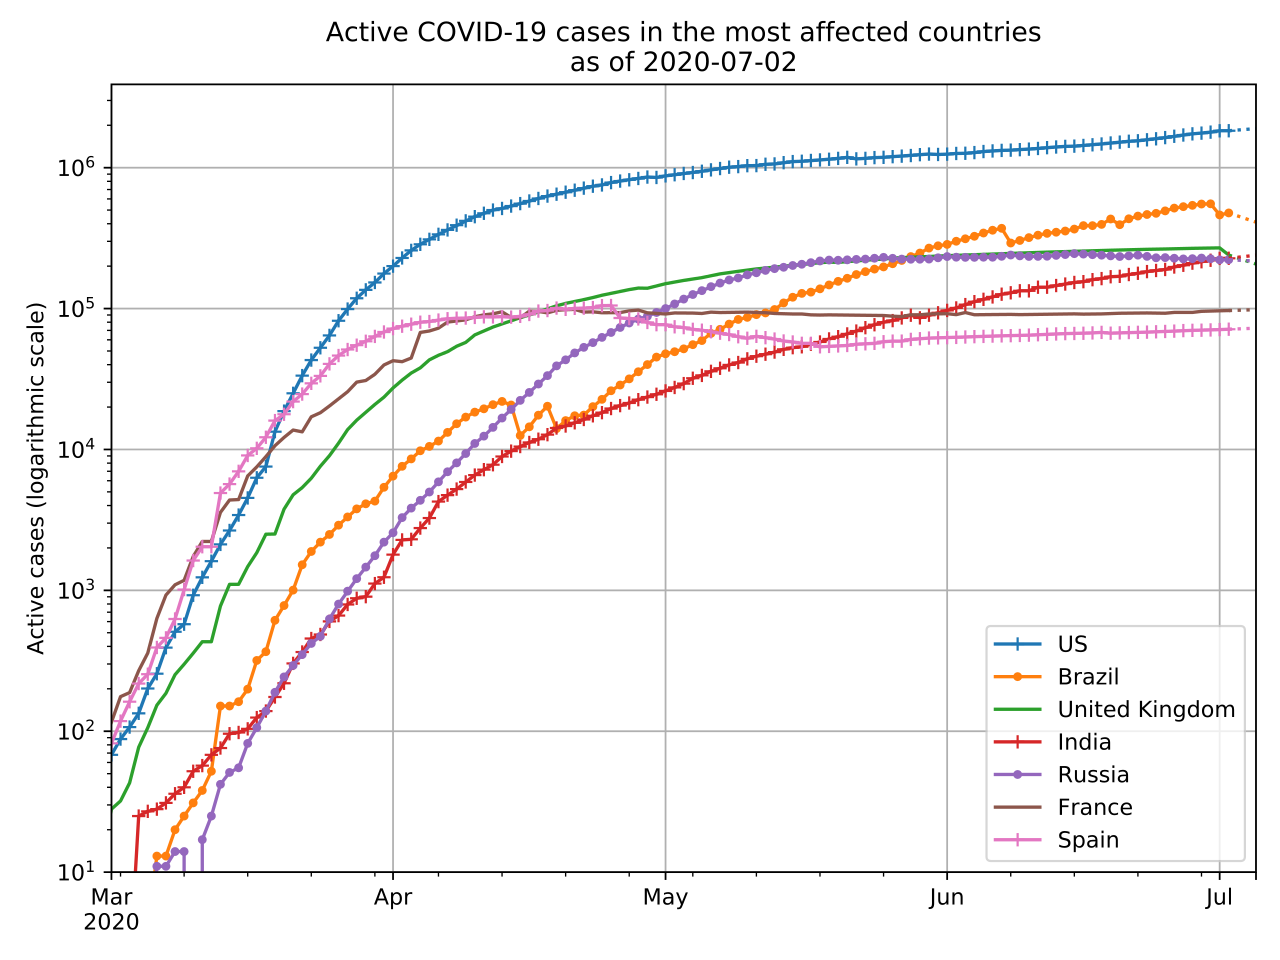
English:
Time series plot of the number of active COVID-19 cases for the 7 most affected countries, including presumptive positive cases. Note that the vertical axis is logarithmically scaled. The dotted lines show 3-day forecasts based on exponential regression over the last 4 days of data. (Data source:
https://github.com/CSSEGISandData/COVID-19
)
Español:
Series de tiempo de casos activos de COVID-19 en los 7 países más afectados, incluidos los sospechosos positivos. Observe que el eje vertical está escalado logarítmicamente. Las líneas punteadas muestran predicciones de 3 días basadas en regresión exponencial en los últimos 4 días de datos. (Los datos son de
https://github.com/CSSEGISandData/COVID-19
)
|
| Date | |
| Source | Own work |
| Author | Getreuer |
Licensing
I, the copyright holder of this work, hereby publish it under the following license:
This file is licensed under the
Creative Commons
Attribution-Share Alike 4.0 International
license.
-
You are free:
- to share – to copy, distribute and transmit the work
- to remix – to adapt the work
-
Under the following conditions:
- attribution – You must give appropriate credit, provide a link to the license, and indicate if changes were made. You may do so in any reasonable manner, but not in any way that suggests the licensor endorses you or your use.
- share alike – If you remix, transform, or build upon the material, you must distribute your contributions under the same or compatible license as the original.