Total_CO2_by_Region.svg

Size of this PNG preview of this SVG file:
800 × 568 pixels
.
Other resolutions:
320 × 227 pixels
|
640 × 455 pixels
|
1,024 × 727 pixels
|
1,280 × 909 pixels
|
2,560 × 1,819 pixels
|
960 × 682 pixels
.
Summary
| Description |
English:
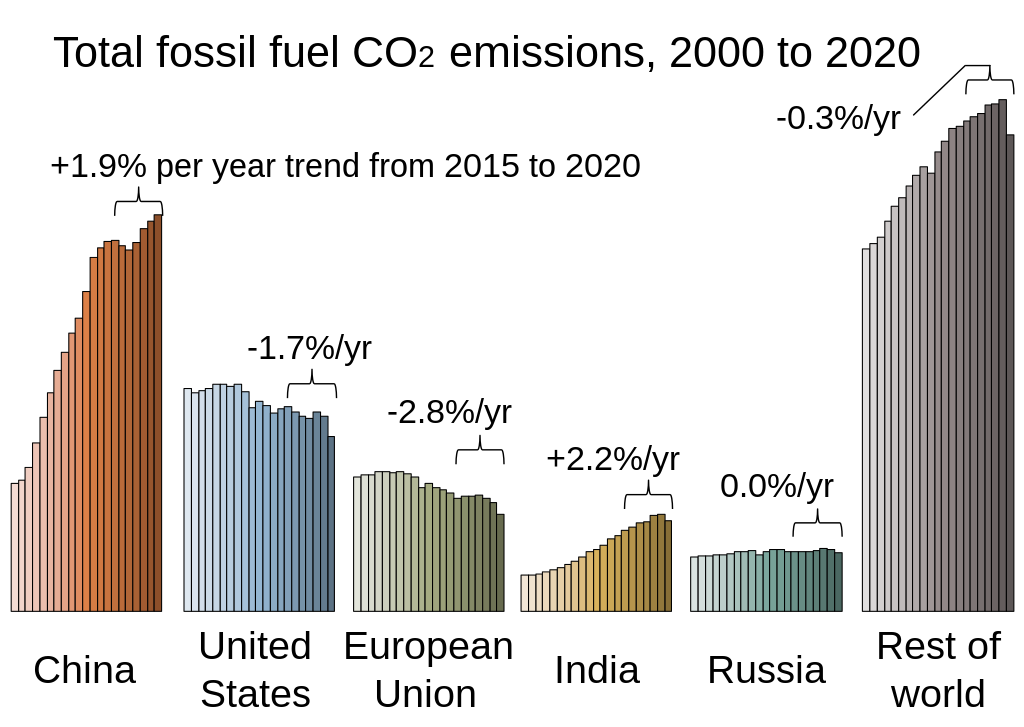
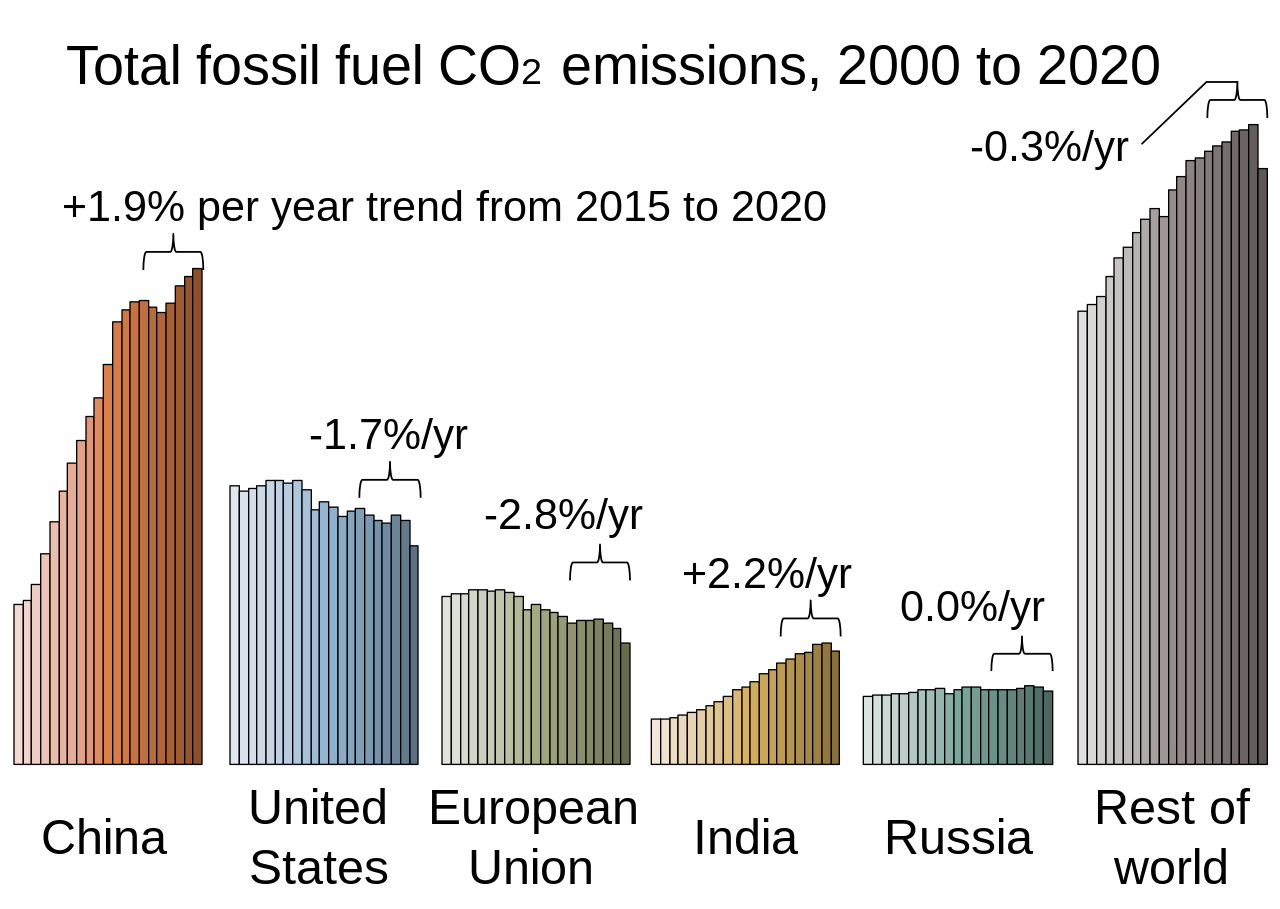
To track the largest emitters of carbon dioxide from burning fossil fuels, this chart shows emissions per region from 2000 to 2020. The trend since 2015 is also highlighted in this adaptation of a chart from the
Global Carbon Project
. The specific source is
[1]
(distributed under Creative Commons Attribution 4.0 License), based primarily on the image "Global CO2 emissions by region", with russian data aggregated in.
العربية:
رسمٌ بياني يُوضّح انبعاثات غاز ثاني أكسيد الكربون من حرقِ الوقود الأحفوري في عددٍ من الدول وذلك من عام 2000 حتى عام 2020.
|
| Date | |
| Source | Own work |
| Author | Efbrazil |
Licensing
I, the copyright holder of this work, hereby publish it under the following license:
This file is licensed under the
Creative Commons
Attribution-Share Alike 4.0 International
license.
-
You are free:
- to share – to copy, distribute and transmit the work
- to remix – to adapt the work
-
Under the following conditions:
- attribution – You must give appropriate credit, provide a link to the license, and indicate if changes were made. You may do so in any reasonable manner, but not in any way that suggests the licensor endorses you or your use.
- share alike – If you remix, transform, or build upon the material, you must distribute your contributions under the same or compatible license as the original.