U.K.-Tax-Revenues-As-GDP-Percentage-(75-05).jpg

Size of this preview:
800 × 418 pixels
.
Other resolutions:
320 × 167 pixels
|
640 × 334 pixels
|
1,412 × 737 pixels
.
Summary
| Description |
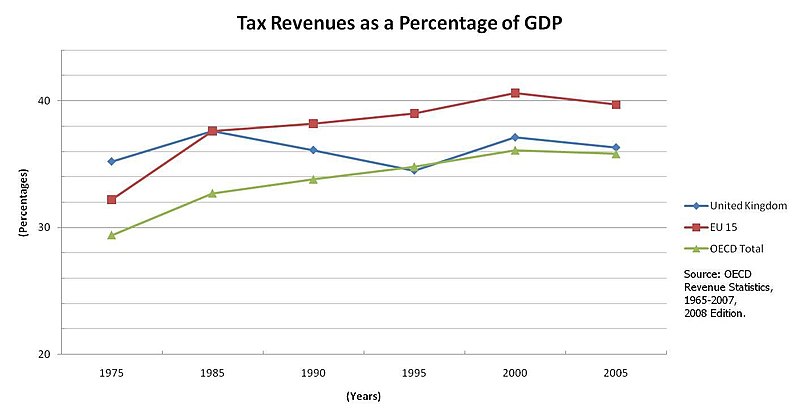
English:
This image portrays total tax revenue as a percentage of GDP from 1975 to 2005 for the United Kingdom in comparison to both the unweighted average for the OECD as well as for the EU 15. Note that the EU 15 area countries are: Austria, Belgium, Denmark, Finland, France, Germany, Greece, Ireland, Italy, Luxembourg, Netherlands, Portugal, Spain, Sweden and United Kingdom. Further information is available
here
at
oecd.org
|
||||
| Date | |||||
| Source | Own work | ||||
| Author | Sugar-Baby-Love | ||||
| Other versions |
There are similar images
here
, for the United States, and
here
, for Germany.
This graph
compares nine nations to each other.
A graph without 1975 data and with a shorter Y-axis is here . |
||||

.JPG)
.JPG)
.JPG)
.JPG)
Licensing
I, the copyright holder of this work, hereby publish it under the following license:
|
|
This file is made available under the Creative Commons CC0 1.0 Universal Public Domain Dedication . |
|
The person who associated a work with this deed has dedicated the work to the
public domain
by waiving all of their rights to the work worldwide under copyright law, including all related and neighboring rights, to the extent allowed by law. You can copy, modify, distribute and perform the work, even for commercial purposes, all without asking permission.
|