U.S._Income_and_Net_Worth_Distribution.png
Size of this preview:
800 × 449 pixels
.
Other resolutions:
320 × 180 pixels
|
640 × 359 pixels
|
1,316 × 739 pixels
.

|
This
graph
image could be re-created
using
vector graphics
as an
SVG
file
. This has several advantages; see
Commons:Media for cleanup
for more information. If an SVG form of this image is available, please upload it and afterwards replace this template with
{{

vector version available

|

new image name

}}
.
It is recommended to name the SVG file “U.S. Income and Net Worth Distribution.svg”—then the template Vector version available (or Vva ) does not need the new image name parameter. |
Summary
| Description |
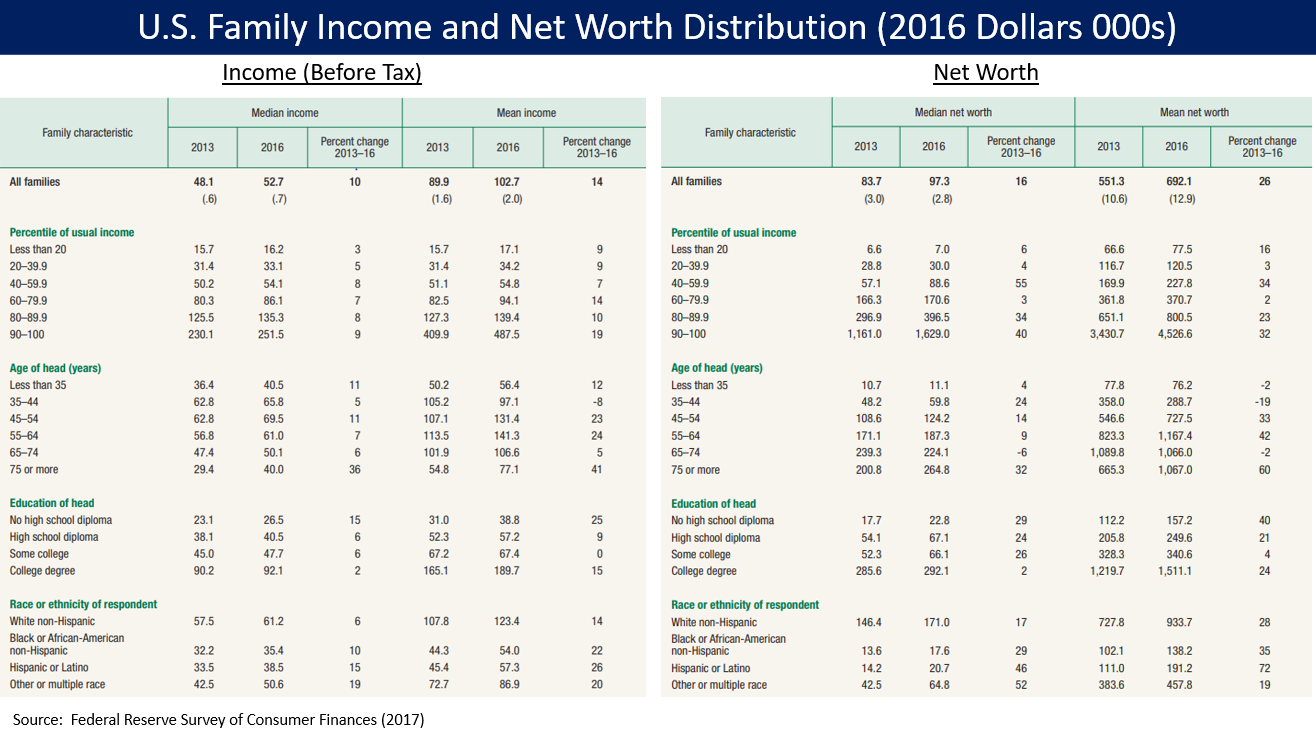
English:
U.S. family pre-tax income and net worth distribution for 2013 and 2016, from the
Survey of Consumer Finances
by the
US Federal Reserve Board
.
|
| Date | 16 June 2018 - date of first upload to the Commons. |
| Source | Federal Reserve Bulletin . September 2017, Vol. 103, No. 3. See PDF: Changes in U.S. Family Finances from 2013 to 2016: Evidence from the Survey of Consumer Finances . Table 1 (on the left) is taken from page 4 of the PDF. Table 2 (on the right) is taken from page 13. See: Survey of Consumer Finances and more data . |
| Author | Federal Reserve Bulletin . |
Licensing
|
|
This work is in the public domain in the United States because it is a work of the Board of Governors of the Federal Reserve System . This does not apply to any other entity within the Federal Reserve System, including the regional Federal Reserve Banks. |

|