U.S._Treasuries.png

Size of this preview:
800 × 340 pixels
.
Other resolutions:
320 × 136 pixels
|
640 × 272 pixels
|
1,024 × 435 pixels
|
1,873 × 795 pixels
.

|
File:U.S. Treasuries.svg
is a vector version of this file. It should be used in place of this PNG file when not inferior.
File:U.S. Treasuries.png →
File:U.S. Treasuries.svg
For more information, see
Help:SVG
.
|

|
Summary
| Description |
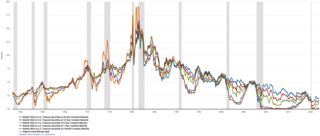
English:
United States Treasuries history compared to the Federal Funds Rate
|
| Date | |
| Source | Board of Governors of the Federal Reserve System (US), 30-Year Treasury Constant Maturity Rate [GS30], retrieved from FRED, Federal Reserve Bank of St. Louis; https://fred.stlouisfed.org/graph/?id=GS30,GS10,GS5,GS1,GS3M,FEDFUNDS . A .png version is available here |
| Author | Board of Governors of the Federal Reserve System, FRED |
Licensing
|
|
This chart is
ineligible for
copyright
and therefore in the
public domain
, because it consists entirely of information that is common property and contains no original authorship. For more information, see
Commons:Threshold of originality § Charts
|