US_2010_Census_State_Population_Per_Electoral_Vote.png

Size of this preview:
800 × 529 pixels
.
Other resolutions:
320 × 212 pixels
|
640 × 423 pixels
|
1,024 × 677 pixels
|
1,280 × 846 pixels
|
2,048 × 1,354 pixels
.
Summary
| Description |
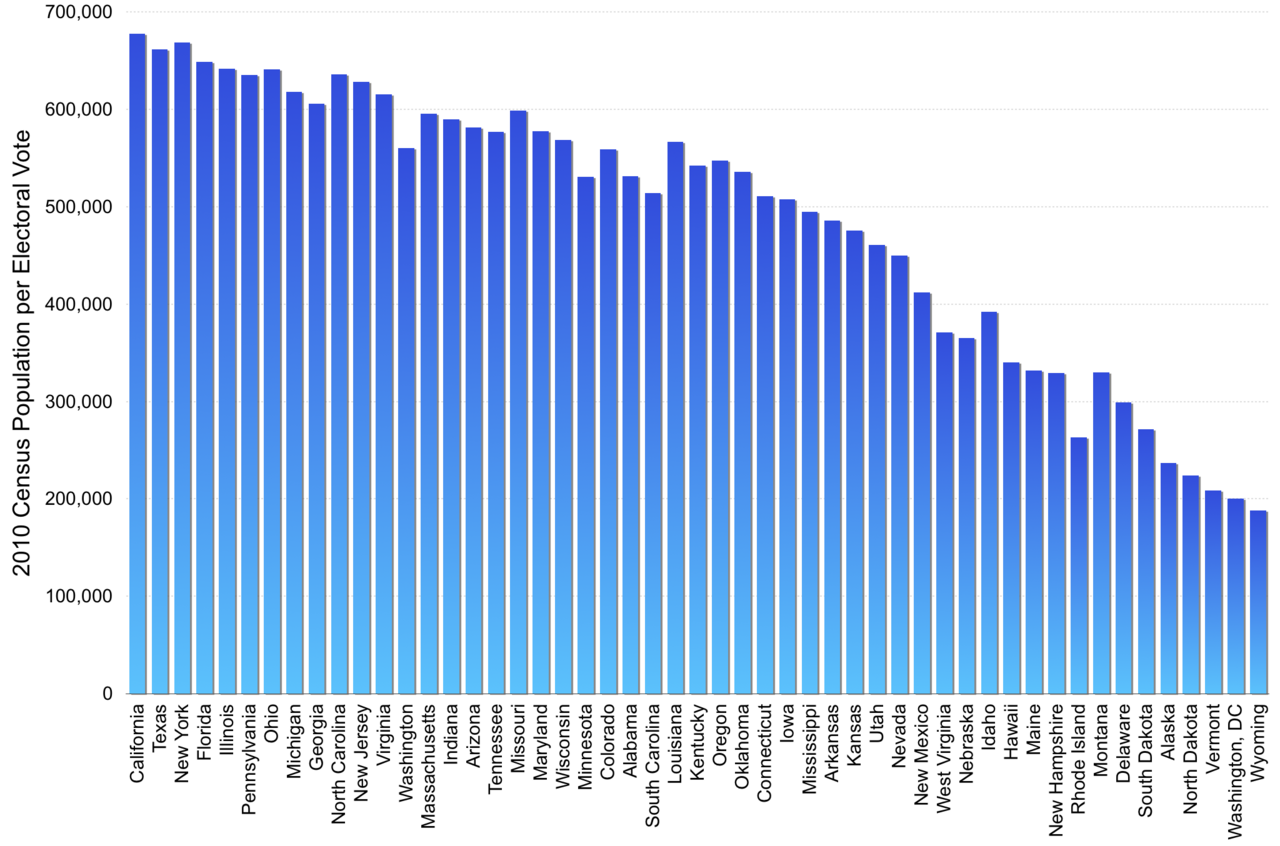
English:
Chart showing 2010 census state population per electoral vote for the 50 states and Washington D.C. States are sorted from left to right based on total population, using 2010 census population from
https://en.wikipedia.org/wiki/List_of_U.S._states_and_territories_by_population#States_and_territories
, and 2011-2021 electoral votes per state (from apportionment following 2010 census).
|
| Date | |
| Source | Own work |
| Author | Perl coder |
Licensing
I, the copyright holder of this work, hereby publish it under the following license:
This file is licensed under the
Creative Commons
Attribution-Share Alike 4.0 International
license.
-
You are free:
- to share – to copy, distribute and transmit the work
- to remix – to adapt the work
-
Under the following conditions:
- attribution – You must give appropriate credit, provide a link to the license, and indicate if changes were made. You may do so in any reasonable manner, but not in any way that suggests the licensor endorses you or your use.
- share alike – If you remix, transform, or build upon the material, you must distribute your contributions under the same or compatible license as the original.