Uneconomic_Growth_diagram.jpg

Size of this preview:
616 × 599 pixels
.
Other resolutions:
247 × 240 pixels
|
494 × 480 pixels
|
790 × 768 pixels
|
1,024 × 996 pixels
.


Summary
| Description |
English:
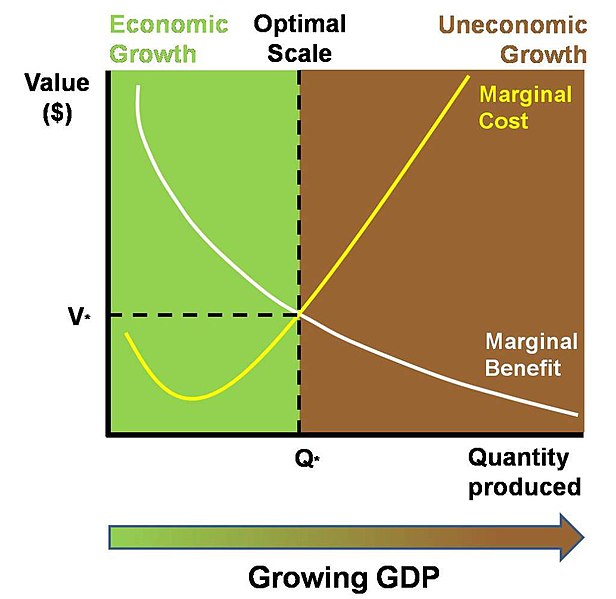
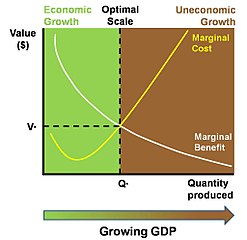
Diagram showing the marginal costs of a growing economy gradually exceeding the marginal benefits, eventually resulting in 'uneconomic growth'. The optimal scale of the economy Q* is where costs equal benefits at V*, marking the divide between the 'economic' green part of the diagram to the left and the 'uneconomic' brown part to the right.
|
| Date | |
| Source | http://www.steadystate.org/discover/downsides-of-economic-growth |
| Author | Center for the Advancement of the Steady State Economy |
Licensing
This file is licensed under the
Creative Commons
Attribution 3.0 Unported
license.
-
You are free:
- to share – to copy, distribute and transmit the work
- to remix – to adapt the work
-
Under the following conditions:
- attribution – You must give appropriate credit, provide a link to the license, and indicate if changes were made. You may do so in any reasonable manner, but not in any way that suggests the licensor endorses you or your use.