World_energy_consumption.svg

Size of this PNG preview of this SVG file:
750 × 560 pixels
.
Other resolutions:
320 × 239 pixels
|
640 × 478 pixels
|
1,024 × 765 pixels
|
1,280 × 956 pixels
|
2,560 × 1,911 pixels
.
Summary
| Description |
English:
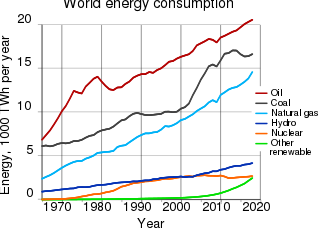
World energy consumption
.
Deutsch:
Weltenergiebedarf.
|
| Date | |
| Source | BP Statistical Review of World Energy 2017 |
| Author | Con-struct |
| Other versions |
[
]
|
| SVG development |
This
vector image
was created with
Inkscape
, or with something else
.
This file uses
embedded
text that can be
easily translated
using a text editor.
|
| Note |
English:
This svg file contains the original graph data.
Deutsch:
Die svg-Datei enthält die dargestellten Daten als Original-Werte.
|
| Template for indication of the source |
<ref name="BP-Review-2014">BP: [
http://www.bp.com/statisticalreview
Statistical Review of World Energy
], Workbook (xlsx), London, 2014</ref>
|


Generated with Wikimedia SVG Chart
| Data format |
The source data of the chart is in the SVG image file in a clearly readable format. You see the original numbers inside of the SVG file in the form of a list such as this:
... 1995 10.06 1996 11.75 1997 12.45 ... |
| Content of SVG |
To view the data download the SVG file itself. To do so right-click this link, and then choose the option to save:
File:World energy consumption.svg
. Launch any
text editor
. Open the downloaded SVG file with the text editor (usually; file menu, open). To see the list of data, search for the phrase
id="graph1"
.
|
|
|
Please,
do not
use a special SVG editor such as Inkscape; the readability of the database would be destroyed. You can edit the SVG file with any
text editor
, for example;
en: List of text editors
. You can view the edited SVG file in various web browsers. As of 2011, all major desktop browsers, and many minor ones, have some level of SVG support. See:
en: Scalable Vector Graphics#Support for SVG in web browsers
. When satisfied with your edits, upload the edited SVG file with the link labeled "Upload a new version of this file".
W3C-validity not checked.
This
chart
was created with
Wikimedia SVG Chart
.
This
chart
uses
embedded
text/digits.
|
| Code to generate SVG | See: File talk:World energy consumption.svg . Documentation see: Wikimedia SVG Chart . |
Conversions

| - Power in Watt | |
| - Power in toe (tonne of oil equivalent) | |
| - Conversion factor of tonne of oil equivalent to watt, 11.63 megawatt hours / toe | |
| - Energy conversion efficiency , 38%, see BP statistical_review_of_world_energy_2013.pdf |


Example
| , statistical_review_of_world_energy_2013_workbook.xlsx, tab "Oil Production – tonnes", cell "AW89" | |
| , see Terawatt |


The conversion factor is exactly 4.4194 TWh/Mtoe, according to the ...workbook.xlsx , tab "Approximate conversion factors".
Licensing
I, the copyright holder of this work, hereby publish it under the following licenses:

|
Permission is granted to copy, distribute and/or modify this document under the terms of the GNU Free Documentation License , Version 1.2 or any later version published by the Free Software Foundation ; with no Invariant Sections, no Front-Cover Texts, and no Back-Cover Texts. A copy of the license is included in the section entitled GNU Free Documentation License . |
This file is licensed under the
Creative Commons
Attribution-Share Alike
3.0 Unported
,
2.5 Generic
,
2.0 Generic
and
1.0 Generic
license.
-
You are free:
- to share – to copy, distribute and transmit the work
- to remix – to adapt the work
-
Under the following conditions:
- attribution – You must give appropriate credit, provide a link to the license, and indicate if changes were made. You may do so in any reasonable manner, but not in any way that suggests the licensor endorses you or your use.
- share alike – If you remix, transform, or build upon the material, you must distribute your contributions under the same or compatible license as the original.
You may select the license of your choice.