World_population_growth_rate_1950–2050.svg

Size of this PNG preview of this SVG file:
800 × 379 pixels
.
Other resolutions:
320 × 152 pixels
|
640 × 303 pixels
|
1,024 × 485 pixels
|
1,280 × 606 pixels
|
2,560 × 1,213 pixels
|
1,900 × 900 pixels
.
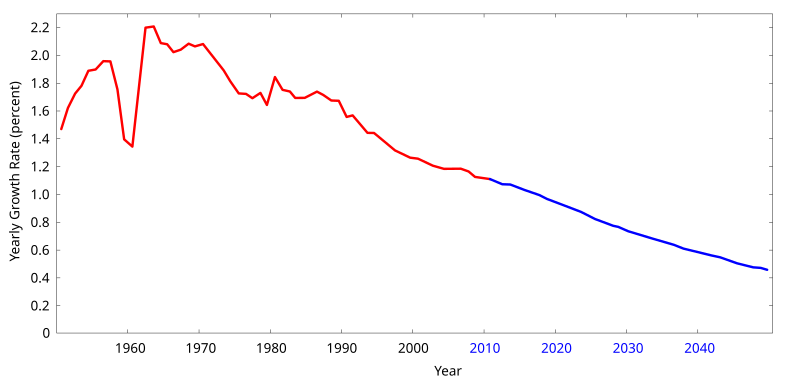
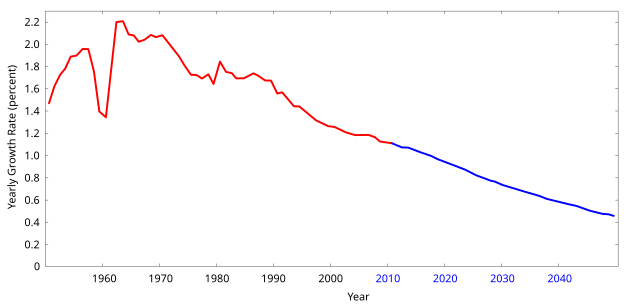
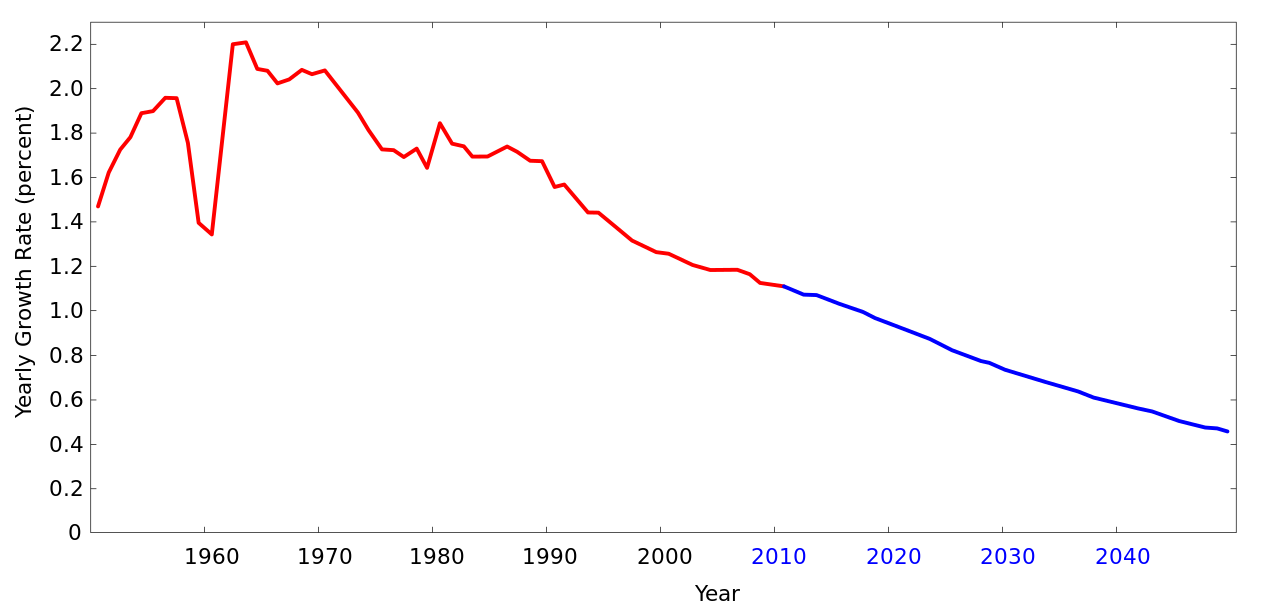
Summary
A chart of changes in world population growth rate from 1950–2010 ( red ) and predicted changes in world population growth rate from 2010–2050 ( blue ).
The original was created 6 Dec 2003 by Securiger from data provided by the U.S. Census Bureau .
Converted to SVG by Conscious .
History on English Wikipedia
- (Delete all revisions of this file) (cur) 22:14, 27 March 2006 . . Casito (Talk | contribs | block) . . 1200×900 (11,907 bytes) (Excel Graphs look unprofessional. This is done in GNUPlot using the same source data. Also adjusted to show the more useful percent growth (vs. abs. growth))
- (del) (rev) 15:50, 26 August 2005 . . Riumplus (Talk | contribs | block) . . 512×400 (3,103 bytes) (Removed unused colours from the PNG pallete, shrinking the file size by 41%)
- (del) (rev) 13:23, 6 December 2003 . . Securiger (Talk | contribs | block) . . 512×400 (5,242 bytes) (A chart of changes in world population 1952-2002)
Licensing
|
|
This file is licensed under the Creative Commons Attribution-Share Alike 3.0 Unported license. Subject to disclaimers . | |
|
||
| This licensing tag was added to this file as part of the GFDL licensing update . |

|
Permission is granted to copy, distribute and/or modify this document under the terms of the GNU Free Documentation License , Version 1.2 or any later version published by the Free Software Foundation ; with no Invariant Sections, no Front-Cover Texts, and no Back-Cover Texts. A copy of the license is included in the section entitled GNU Free Documentation License . Subject to disclaimers . |