Earth's_Heat_Accumulation.png

Size of this preview:
800 × 564 pixels
.
Other resolutions:
320 × 225 pixels
|
640 × 451 pixels
|
954 × 672 pixels
.
Summary
| Description |
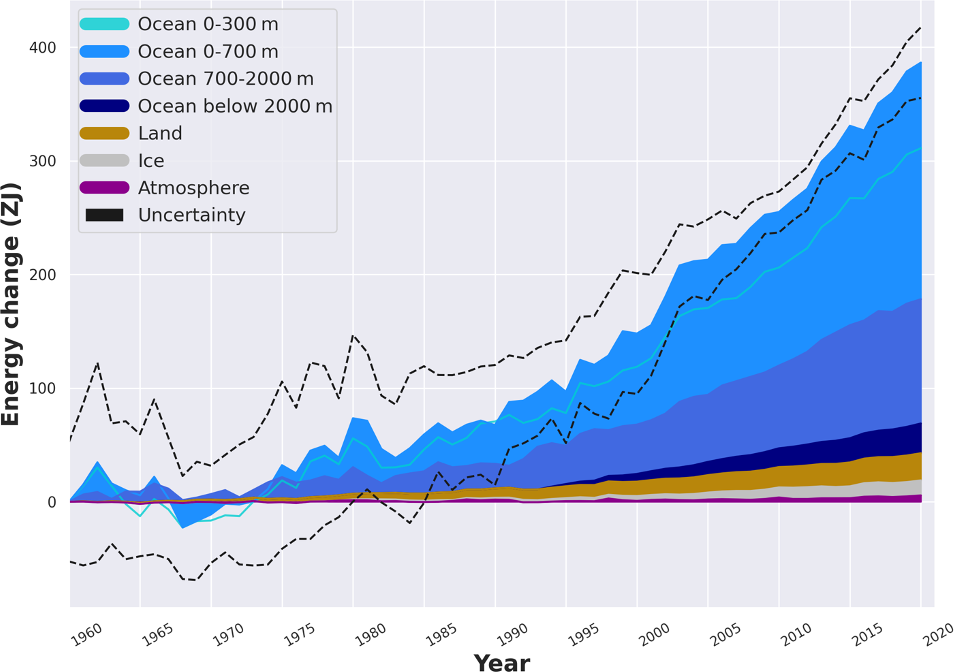
English:
This graph shows the buildup of excess heat (thermal energy) in the ocean, land, ice, and atmospheric components of the Earth system since year 1960. The energy change is evaluated as ZettaJoules (=10
21
Joules). The heat propagation to greater ocean depths with time is evident. Dashed lines bracket the total uncertainty of the data from the four components. Red line compares the trend of CERES satellite-based observations of the energy flow imbalance at top of atmosphere (TOA).
Credits
:
|
| Date | |
| Source | https://essd.copernicus.org/articles/15/1675/2023/essd-15-1675-2023-f08.png |
| Author | Karina von Schuckmann, et al. |
Licensing
This file is licensed under the
Creative Commons
Attribution-Share Alike 4.0 International
license.
-
You are free:
- to share – to copy, distribute and transmit the work
- to remix – to adapt the work
-
Under the following conditions:
- attribution – You must give appropriate credit, provide a link to the license, and indicate if changes were made. You may do so in any reasonable manner, but not in any way that suggests the licensor endorses you or your use.
- share alike – If you remix, transform, or build upon the material, you must distribute your contributions under the same or compatible license as the original.