Genetic_distances_Eurasian_West_Asian_East_Asian.png

Size of this preview:
359 × 598 pixels
.
Other resolutions:
144 × 240 pixels
|
288 × 480 pixels
|
461 × 768 pixels
|
1,063 × 1,772 pixels
.
Summary
| Description |
English:
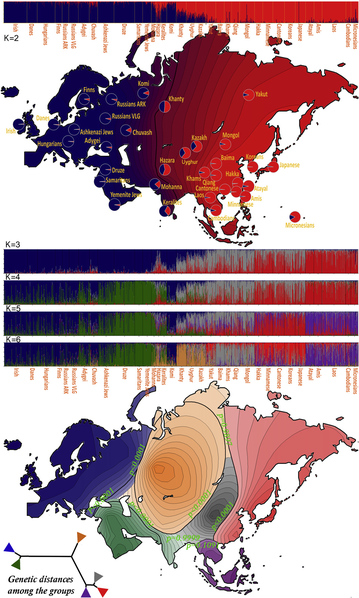
The contour plots and genetic distance tree are color coded to correspond to the STRUCTURE plots. The significance levels for pairwise comparisons of clusters are given on the K = 6 contour plot (bottom) at the relevant borders. (Kidd et al. 2009, Am J Hum Genet. Dec 11, 2009; 85(6): 934–937. doi: 10.1016/j.ajhg.2009.10.024)
العربية:
صورة توضح المسافات الجينية الأوراسية غرب آسيا الشرقية ،حيث تم ترميز قطع الكنتور وشجرة المسافة الوراثية لتتوافق مع قطع هيكلية. يتم إعطاء مستويات الدلالة للمقارنات الزوجية للمجموعات على مخطط كفاف K = 6 (أسفل) عند الحدود ذات الصلة.
[1]
|
| Date | |
| Source | STRUCTURE Bar Views for K = 2–6 and Contour Plots for K = 2 and K = 6 |
| Author | Kidd and Li et al. 2009 |
Licensing
|
|
This image was originally posted to Flickr by j.kidd79 at https://www.flickr.com/photos/126850741@N08/14965013599 . It was reviewed on 6 September 2014 by FlickreviewR and was confirmed to be licensed under the terms of the cc-by-2.0. |
This file is licensed under the
Creative Commons
Attribution 2.0 Generic
license.
-
You are free:
- to share – to copy, distribute and transmit the work
- to remix – to adapt the work
-
Under the following conditions:
- attribution – You must give appropriate credit, provide a link to the license, and indicate if changes were made. You may do so in any reasonable manner, but not in any way that suggests the licensor endorses you or your use.
- ↑ Kidd et al. 2009, Am J Hum Genet. Dec 11, 2009; 85(6): 934–937. doi: 10.1016/j.ajhg.2009.10.024