HRDiagram.png

Size of this preview:
526 × 599 pixels
.
Other resolutions:
211 × 240 pixels
|
421 × 480 pixels
|
720 × 820 pixels
.
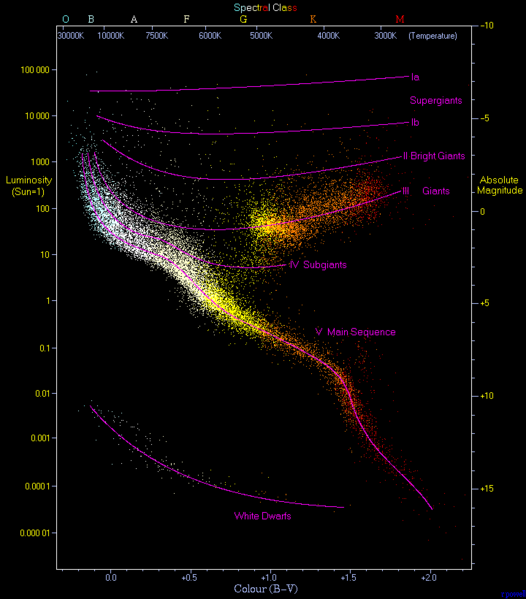
| Description | Hertzsprung–Russell diagram. A plot of luminosity (absolute magnitude) against the colour of the stars ranging from the high-temperature blue-white stars on the left side of the diagram to the low temperature red stars on the right side. "This diagram below is a plot of 22000 stars from the Hipparcos Catalogue together with 1000 low-luminosity stars (red and white dwarfs) from the Gliese Catalogue of Nearby Stars. The ordinary hydrogen-burning dwarf stars like the Sun are found in a band running from top-left to bottom-right called the Main Sequence. Giant stars form their own clump on the upper-right side of the diagram. Above them lie the much rarer bright giants and supergiants. At the lower-left is the band of white dwarfs – these are the dead cores of old stars which have no internal energy source and over billions of years slowly cool down towards the bottom-right of the diagram." Converted to png and compressed with pngcrush. |
| Source | The Hertzsprung Russell Diagram |
| Author | Richard Powell |
|
Permission
( Reusing this file ) |
This file is licensed under the
Creative Commons
Attribution-Share Alike 2.5 Generic
license.
|
| Other versions |
[
]
|


.png)


.svg)


.jpg)


|
This
diagram
image could be re-created
using
vector graphics
as an
SVG
file
. This has several advantages; see
Commons:Media for cleanup
for more information. If an SVG form of this image is available, please upload it and afterwards replace this template with
{{

vector version available

|

new image name

}}
.
It is recommended to name the SVG file “HRDiagram.svg”—then the template Vector version available (or Vva ) does not need the new image name parameter. |