Human_Cortical_Development.png
Size of this preview:
520 × 600 pixels
.
Other resolutions:
208 × 240 pixels
|
416 × 480 pixels
|
666 × 768 pixels
|
888 × 1,024 pixels
|
2,303 × 2,656 pixels
.
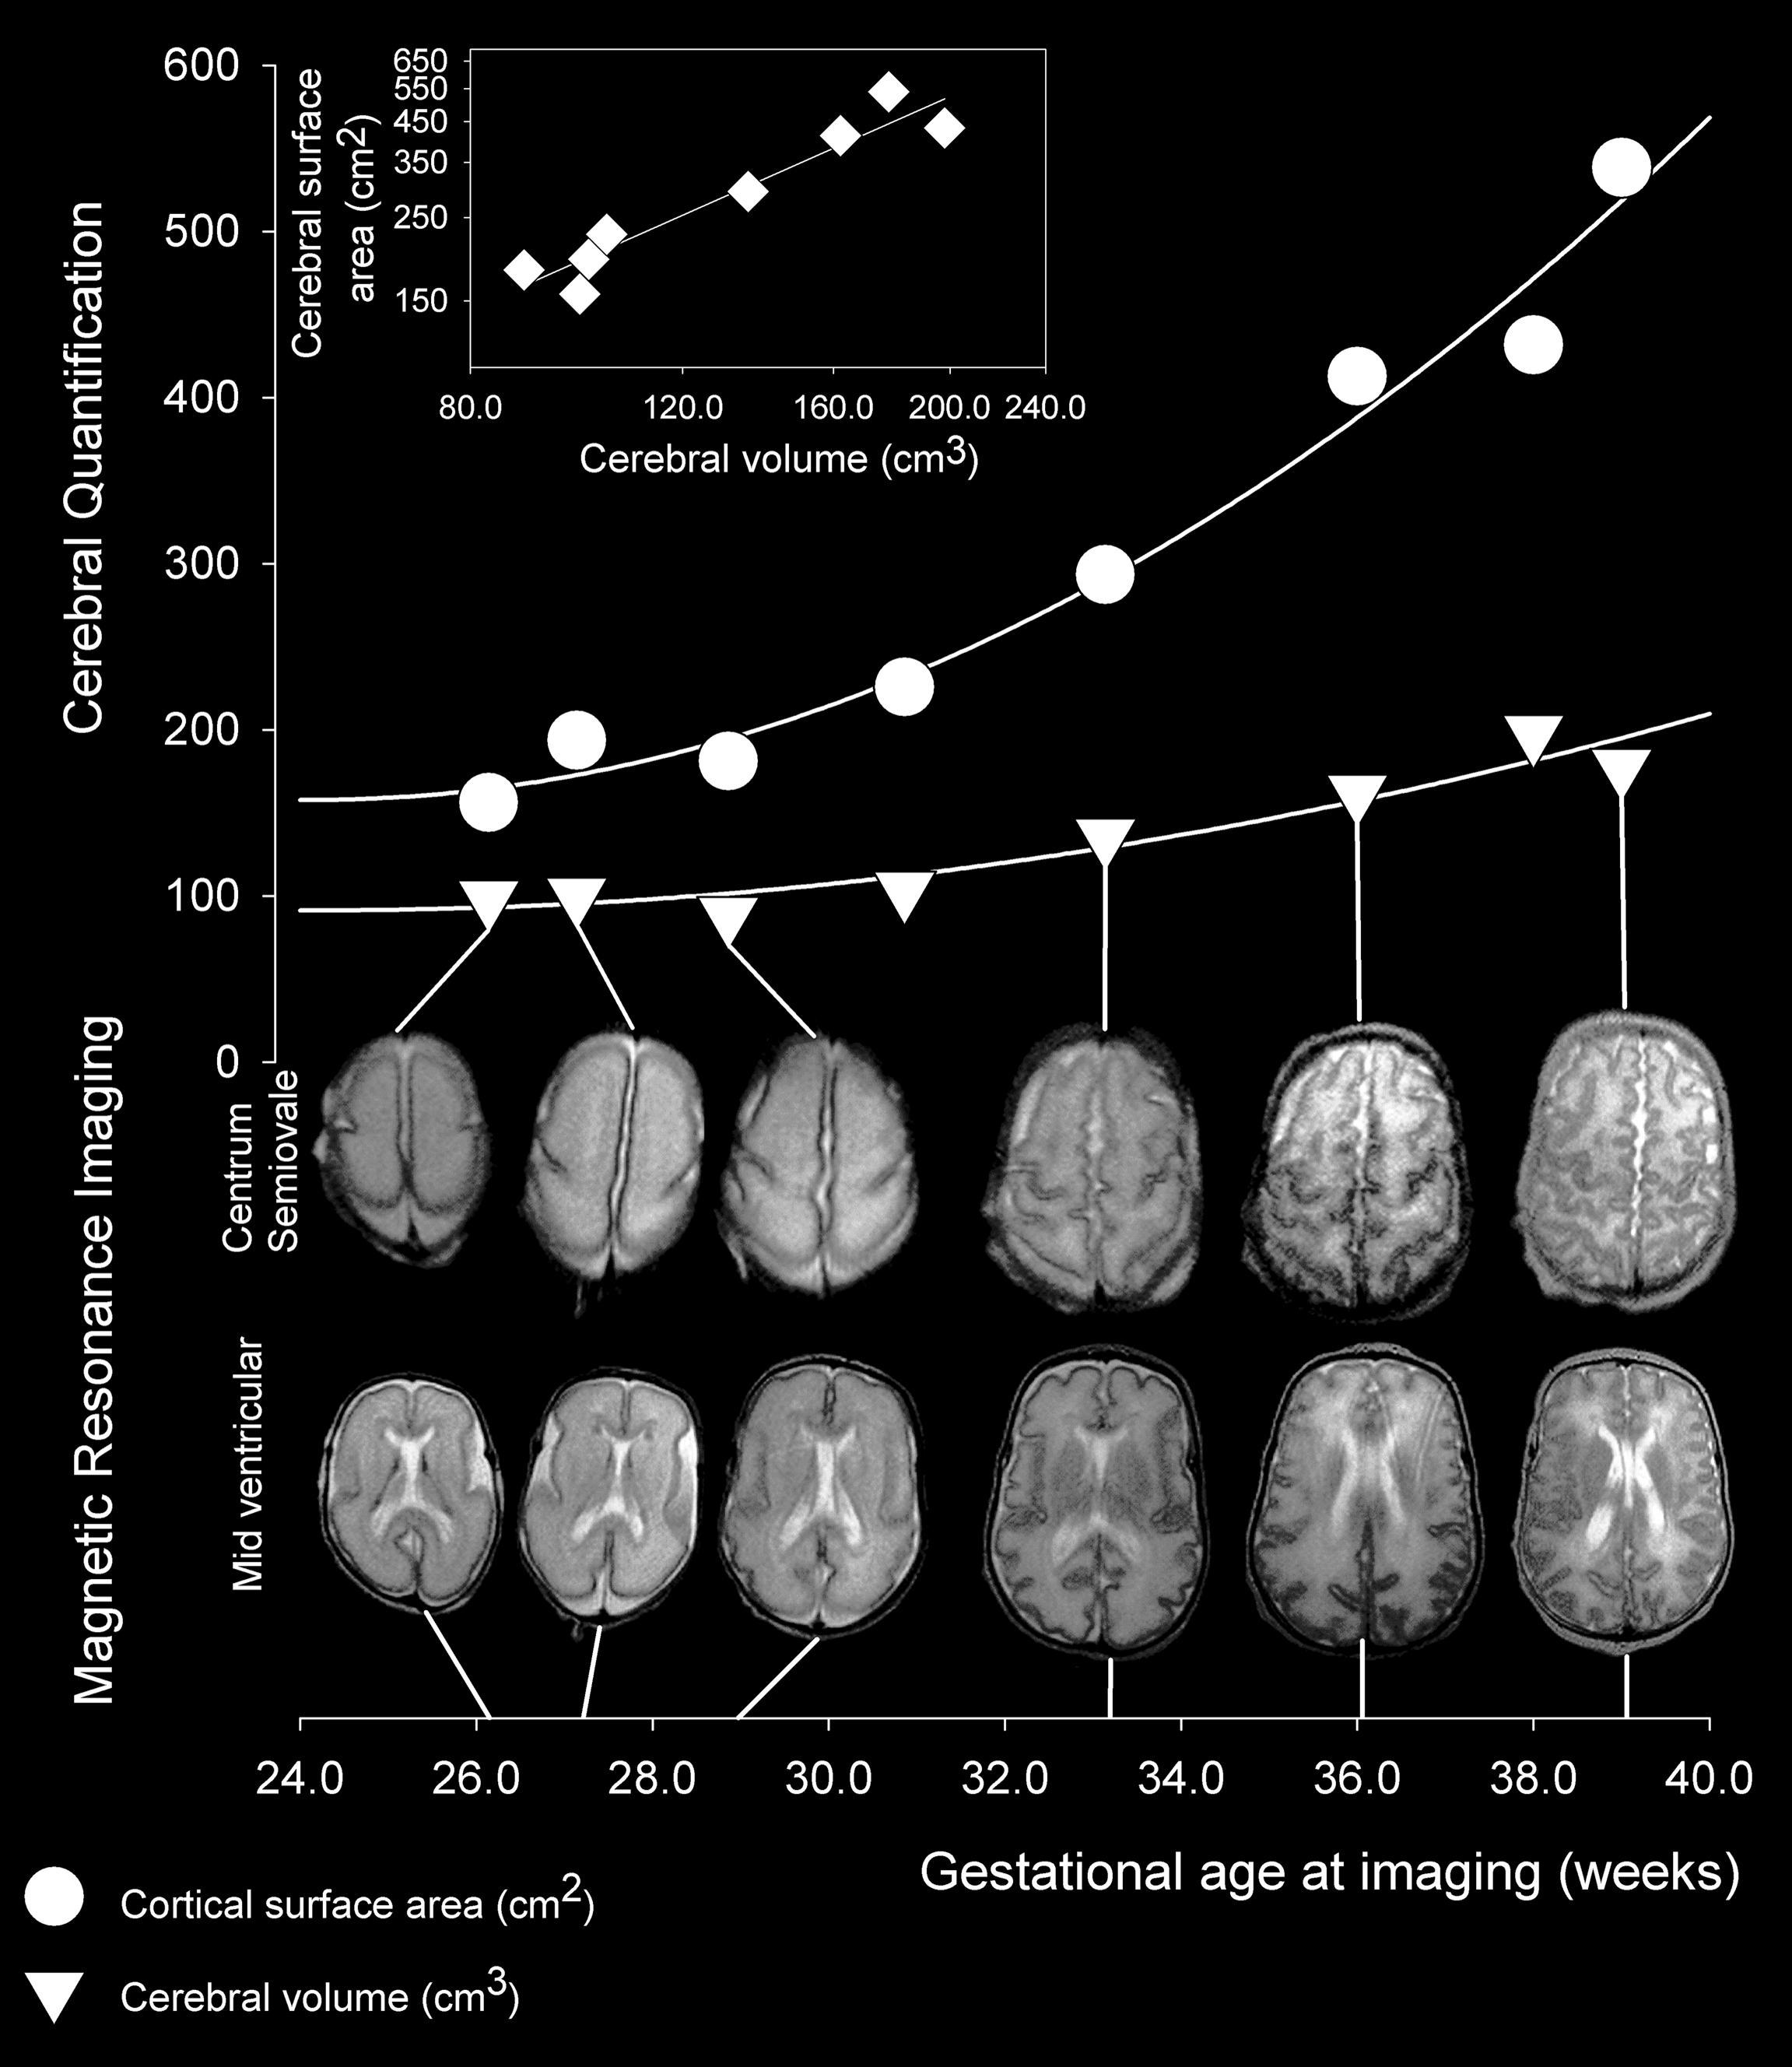
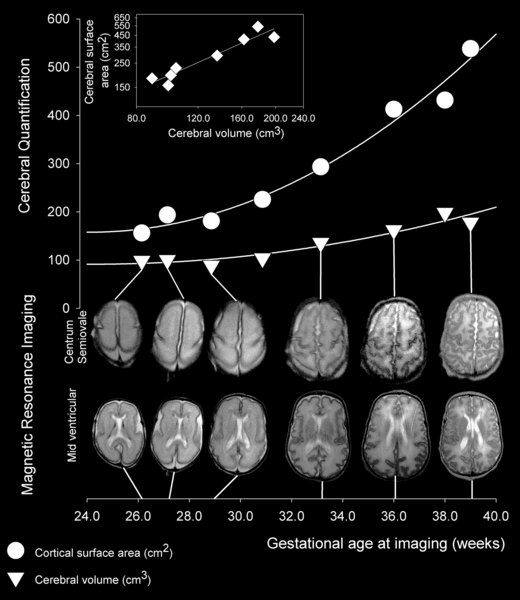
| Description | The images show slices through the brain at the mid-ventricular level and at the level of the centrum semiovale from six of the eight MR images obtained between 26 and 39 week gestational age; images obtained at 30 and 38 weeks are omitted for graphical clarity. Measured values for cerebral volume (triangles) and cortical surface area (circles) are related to relevant image pairs by straight lines. The insert displays a scatter plot in log-log coordinates of cortical surface area and cerebral volume (diamonds), showing a linear relationship that indicates power law scaling of cortical surface area relative to cerebral volume in this individual. | ||
| Date | |||
| Source | Kapellou O, Counsell SJ, Kennea N, Dyet L, Saeed N, et al. (2006) Abnormal Cortical Development after Premature Birth Shown by Altered Allometric Scaling of Brain Growth. PLoS Med 3(8): e265. doi:10.1371/journal.pmed.0030265 | ||
| Author | Kapellou O, Counsell SJ, Kennea N, Dyet L, Saeed N, et al. | ||
|
Permission
( Reusing this file ) |
|