Interpolation_example_polynomial.svg

Size of this PNG preview of this SVG file:
600 × 480 pixels
.
Other resolutions:
300 × 240 pixels
|
960 × 768 pixels
|
1,280 × 1,024 pixels
|
2,560 × 2,048 pixels
.
Summary
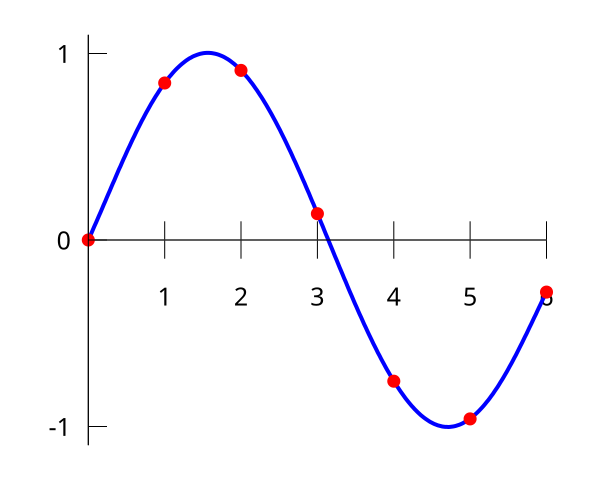
| Description | IIllustration of polynomial interpolation of a data set. The same data set is used for other interpolation algorithms in the Interpolation . |
| Date | |
| Source | self-made in Gnuplot |
| Author | Berland |
Based on png-version by User:Jitse Niesen (with gnuplot source code), and on svg-version by User:Cronholm144 .
Gnuplot source code
set terminal svg fname "Vera" fsize 25
set output "Interpolation_example_polynomial.svg"
set key off
set xzeroaxis
set xtics axis 1,1
set ytics nomirror 1
set samples 300
set border 2
f(x) = - 0.0001521*x**6 - 0.003130*x**5 + 0.07321*x**4 - 0.3577*x**3 +  0.2255*x**2 + 0.9038*x
set yrange [-1.1:1.1]
plot f(x) with lines linetype 3 linewidth 4, \
     "-" with points linetype 1 pointtype 7 pointsize 0.7, \
       0 with lines linetype -1 linewidth 1
0 0
1 0.8415
2 0.9093
3 0.1411
4 -0.7568
5 -0.9589
6 -0.2794
e
Please use at least version 4.2 of Gnuplot for smooth lines in SVG.
Licensing
|
|
This work has been released into the
public domain
by its author,
I,
Berland
. This applies worldwide.
In some countries this may not be legally possible; if so: I, Berland grants anyone the right to use this work for any purpose , without any conditions, unless such conditions are required by law. |