LIGO_detector_sensitivity_curve.png
Size of this preview:
800 × 510 pixels
.
Other resolutions:
320 × 204 pixels
|
640 × 408 pixels
|
1,000 × 637 pixels
.
| Description |
English:
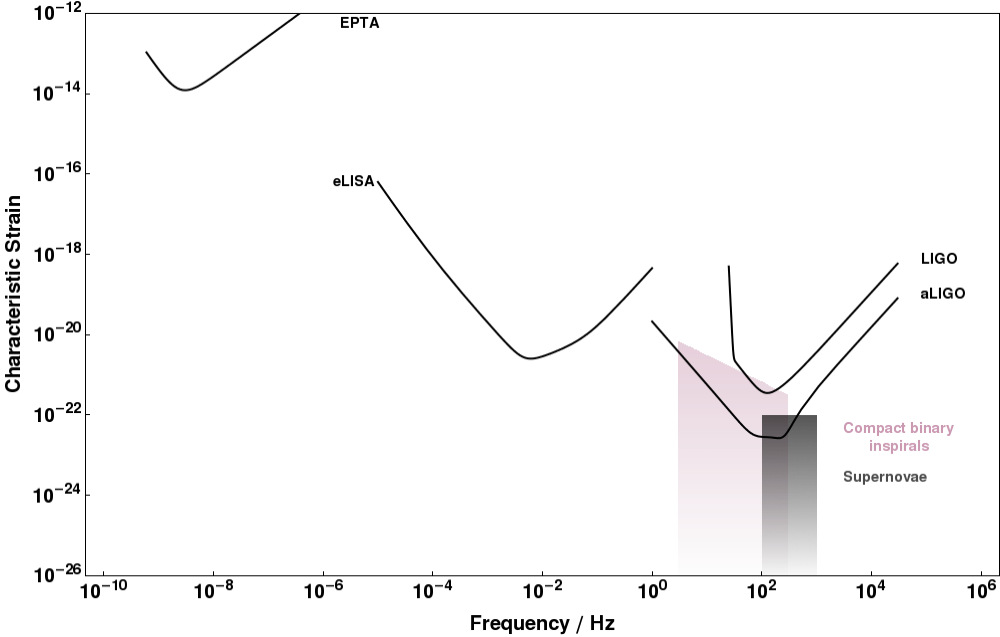
Noise curves of the gravitational-wave detectors LIGO and Advanced LIGO as a function of frequency together with the characteristic strains of the potential gravitational-wave signals they are designed to measure.
|
| Date | |
| Source | http://www.ast.cam.ac.uk/~rhc26/sources/ |
| Author | Christopher Moore, Robert Cole and Christopher Berry |
|
Permission
( Reusing this file ) |
http://www.ast.cam.ac.uk/~rhc26/sources/ |
This file is licensed under the
Creative Commons
Attribution-Share Alike 1.0 Generic
license.
-
You are free:
- to share – to copy, distribute and transmit the work
- to remix – to adapt the work
-
Under the following conditions:
- attribution – You must give appropriate credit, provide a link to the license, and indicate if changes were made. You may do so in any reasonable manner, but not in any way that suggests the licensor endorses you or your use.
- share alike – If you alter, transform, or build upon this work, you must distribute the resulting work under the same license as the original.