NHC_Atlantic_Forecast_Error_Trends.png

Size of this preview:
799 × 599 pixels
.
Other resolutions:
320 × 240 pixels
|
640 × 480 pixels
|
1,024 × 768 pixels
|
1,280 × 960 pixels
|
1,750 × 1,313 pixels
.
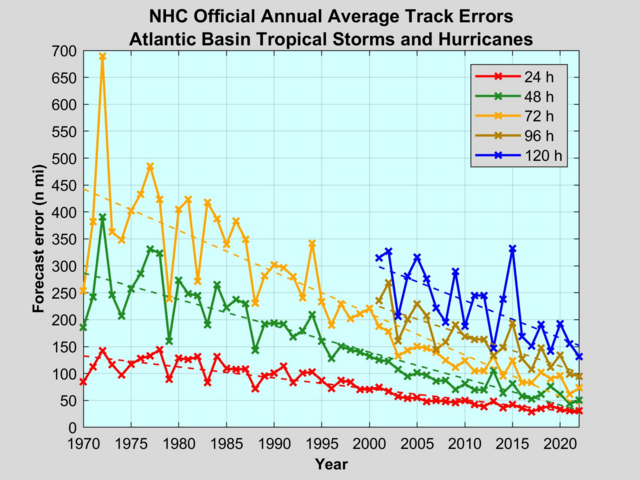
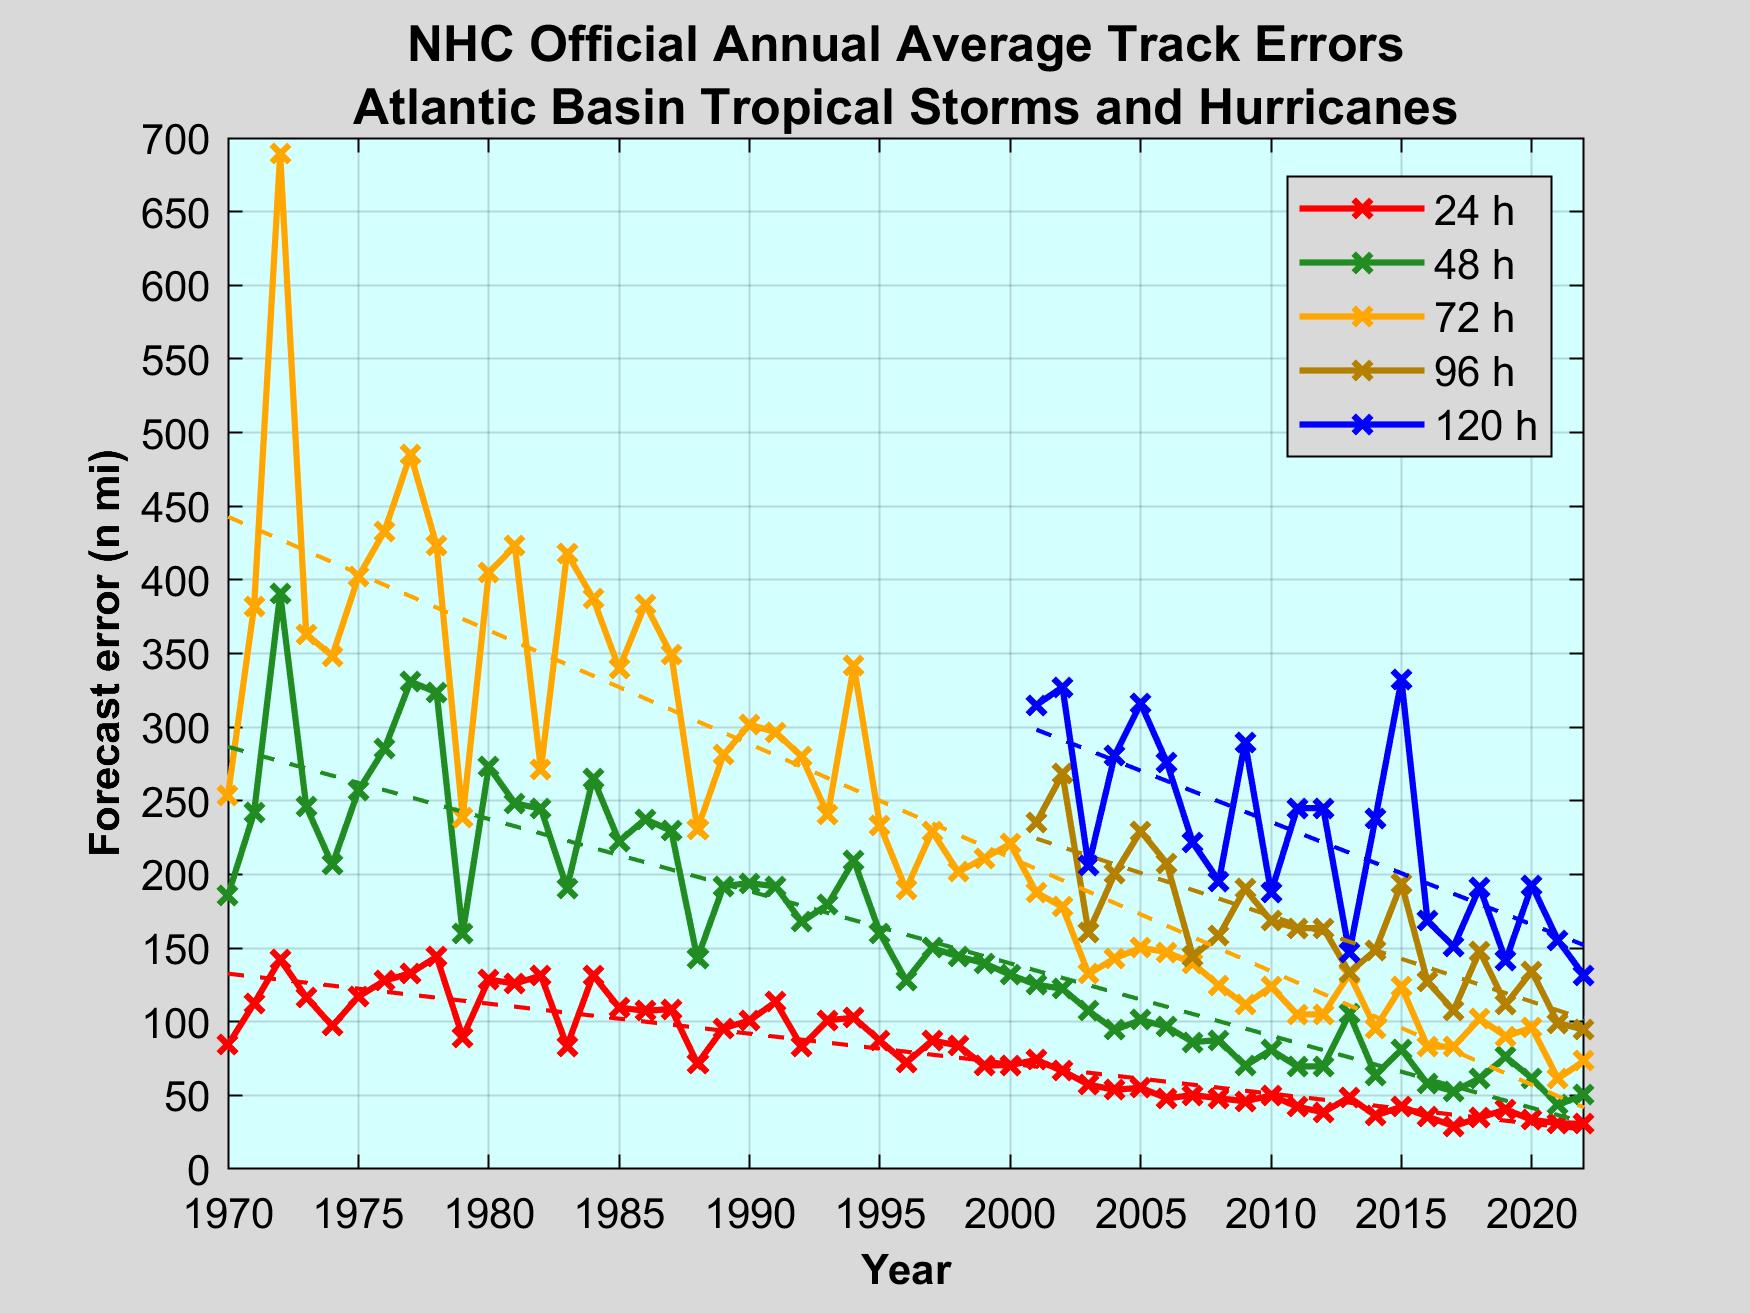
| Description | Error on the track since 1970 in Nautical miles. The different lines represent the forecasted position at different times prior to the verification (ex. 36h means the forecast made 36 h before the verification). |
| Date | (UTC) |
| Source | NOAA from National Hurricane Center Forecast Verification |
| Author | National Hurricane Center |
| Other versions | Image:NHC_Atlantic_Forecast_Error_Trends_FR.png |

|
This
graph
image could be re-created
using
vector graphics
as an
SVG
file
. This has several advantages; see
Commons:Media for cleanup
for more information. If an SVG form of this image is available, please upload it and afterwards replace this template with
{{

vector version available

|

new image name

}}
.
It is recommended to name the SVG file “NHC Atlantic Forecast Error Trends.svg”—then the template Vector version available (or Vva ) does not need the new image name parameter. |
|
|
This image is in the
public domain
because it contains materials that originally came from the U.S.
National Oceanic and Atmospheric Administration
, taken or made as part of an employee's official duties.
|
|