Polarisation_(Elliptical).svg

Size of this PNG preview of this SVG file:
240 × 600 pixels
.
Other resolutions:
96 × 240 pixels
|
192 × 480 pixels
|
307 × 768 pixels
|
409 × 1,024 pixels
|
819 × 2,048 pixels
|
250 × 625 pixels
.
| Description |
English:
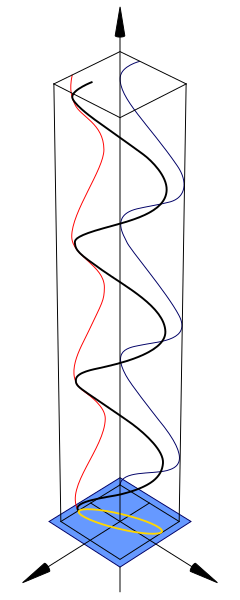
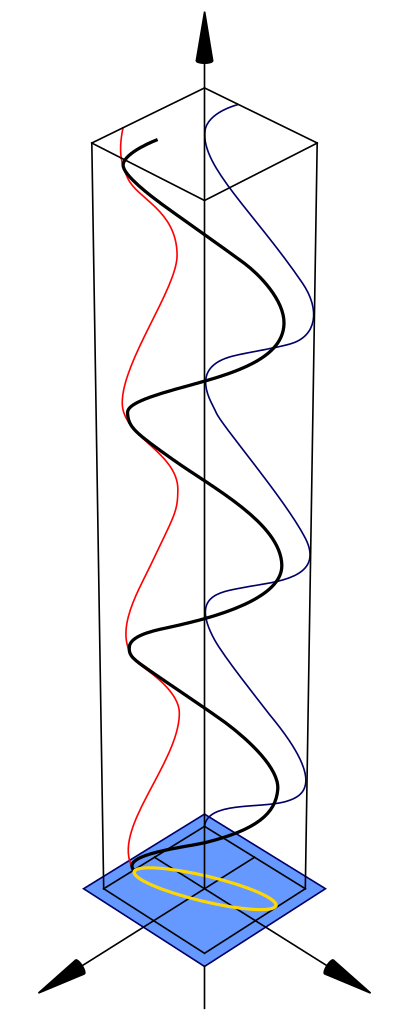
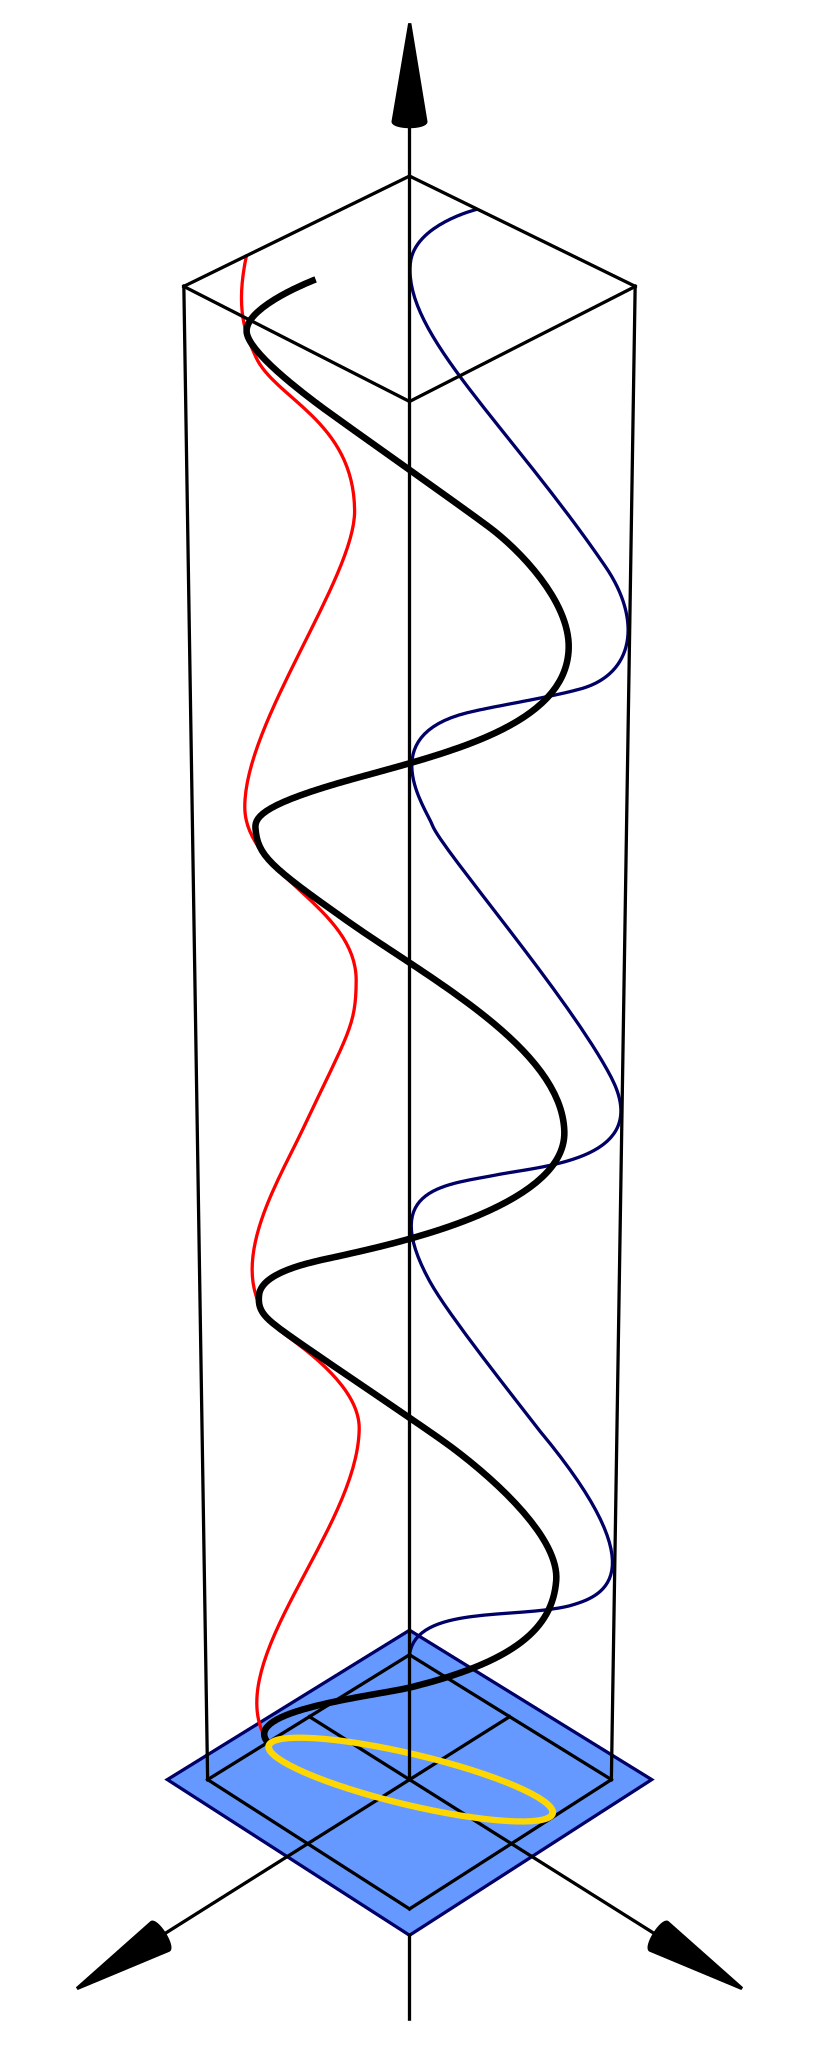
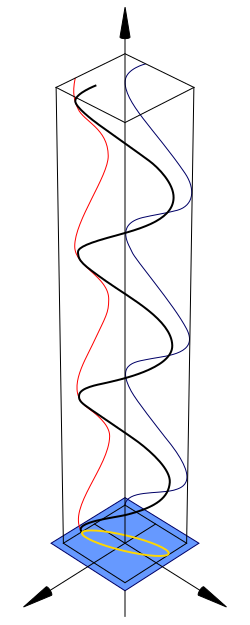
Diagram of elliptical polarisation of electromagnetic radiation
|
||
| Date | 12/02/07 | ||
| Source |
Own drawing down in Mathematica, edited in Inkscape.
This
W3C-unspecified
vector image
was created with
Inkscape
.
|
||
| Author | Inductiveload | ||
|
Permission
( Reusing this file ) |
|
||
| Other versions | Linear polarisation |
.svg)
.svg)
Mathematica Code
This figure requires the use of Arrow3D, which is not included in the StandardPackages (as of Feb 2007). This can be obtained from Wolfram Research at this location . The required packages are:
<< Graphics`
<< Arrow3D`Arrow3D`
The code is:
wavefunction=ParametricPlot3D[{0.5 Sin[4t+1],-Sin[4t],t},{t,0,5},
    BoxRatios\[Rule]{1,
      1,4},ImageSize\[Rule]400,Boxed\[Rule]False,Axes\[Rule]False,
      PlotPoints\[Rule]60,ViewPoint->{2,2, 2},PlotRange\[Rule]All]

repsi=ParametricPlot3D[{0.5 Sin[4t+1],-1,t,RGBColor[1,0,0]},{t,0,5},
      BoxRatios\[Rule]{4,1,1},ImageSize\[Rule]500,
      Boxed\[Rule]False,Axes\[Rule]False,
        PlotPoints\[Rule]60,PlotRange\[Rule]All]

impsi=ParametricPlot3D[{-1,-Sin[4t],t,RGBColor[0,0,102/255]},{
    t,0,5},BoxRatios\[Rule]{4,1,1},ImageSize\[Rule]500,Boxed\[Rule]False,
      Axes\[Rule]False,PlotPoints\[Rule]60,PlotRange\[Rule]All]

end=ParametricPlot3D[{0.5 Sin[t+1],-Sin[t],0},{t,0,2π},BoxRatios\[Rule]{4,1,1},
    ImageSize\[Rule]500,Boxed\[Rule]False,Axes\[Rule]False,
      PlotPoints\[Rule]10,PlotRange\[Rule]All]

xaxis=Graphics3D[Arrow3D[{0,0,-1},{
  0,0,6},HeadSize \[Rule] UniformSize[.5],HeadColor\[Rule]Black]]

uaxis=Graphics3D[Arrow3D[{0,-1,0},{0,3,0},HeadSize \[Rule]
    UniformSize[.5],HeadColor\[Rule]Black]]

vaxis=Graphics3D[Arrow3D[{-1,0,0},{3,0,0},HeadSize \[Rule]
      UniformSize[.5],HeadColor\[Rule]Black]]

plane=Graphics3D[Polygon[{{1.2,1.2,0},{1.2,-1.2,0},{-1.2,-1.2,0},{-1.2,1.2,0}}\
]]

crate=WireFrame[Graphics3D[Cuboid[{1,1,0},{-1,-1,5}]]]

Show[wavefunction,xaxis,uaxis,vaxis,plane,repsi,impsi,end,crate]