Subsolar_point_date_graph.svg

Size of this PNG preview of this SVG file:
512 × 158 pixels
.
Other resolutions:
320 × 99 pixels
|
640 × 198 pixels
|
1,024 × 316 pixels
|
1,280 × 395 pixels
|
2,560 × 790 pixels
.
Summary
| Description |
English:
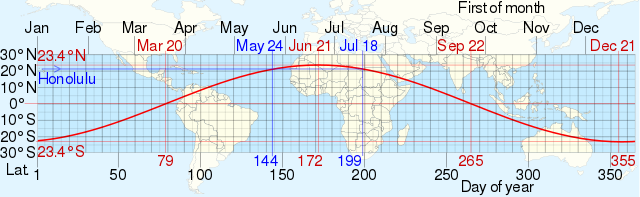
Approximate dates when the solar zenith angle reaches a minimum of 0 degrees vs latitude by CMG Lee superimposed on an equirectangular world map from
http://commons.wikimedia.org/wiki/File:World_location_map.svg
by STyx. The example in blue shows the dates of Lahaina Noon at Honolulu, Hawaii, USA. The red curve is obtained from the Declination of the Sun equation δ=-23.45°*cos[360°/365*(N+10)], where, δ is the Declination of the Sun in ° latitude, N is the day of the year ranging from 1 to 365.
|
|
| Date | ||
| Source |
|
|
| Author | cmglee, STyx et al |

Licensing
This file is licensed under the
Creative Commons
Attribution-Share Alike 4.0 International
license.
-
You are free:
- to share – to copy, distribute and transmit the work
- to remix – to adapt the work
-
Under the following conditions:
- attribution – You must give appropriate credit, provide a link to the license, and indicate if changes were made. You may do so in any reasonable manner, but not in any way that suggests the licensor endorses you or your use.
- share alike – If you remix, transform, or build upon the material, you must distribute your contributions under the same or compatible license as the original.