US_timeline_graphs_of_number_of_people_incarcerated_in_jails_and_prisons.png
Size of this preview:
748 × 600 pixels
.
Other resolutions:
299 × 240 pixels
|
599 × 480 pixels
|
958 × 768 pixels
|
1,277 × 1,024 pixels
|
1,415 × 1,135 pixels
.
Summary
| Description |
English:
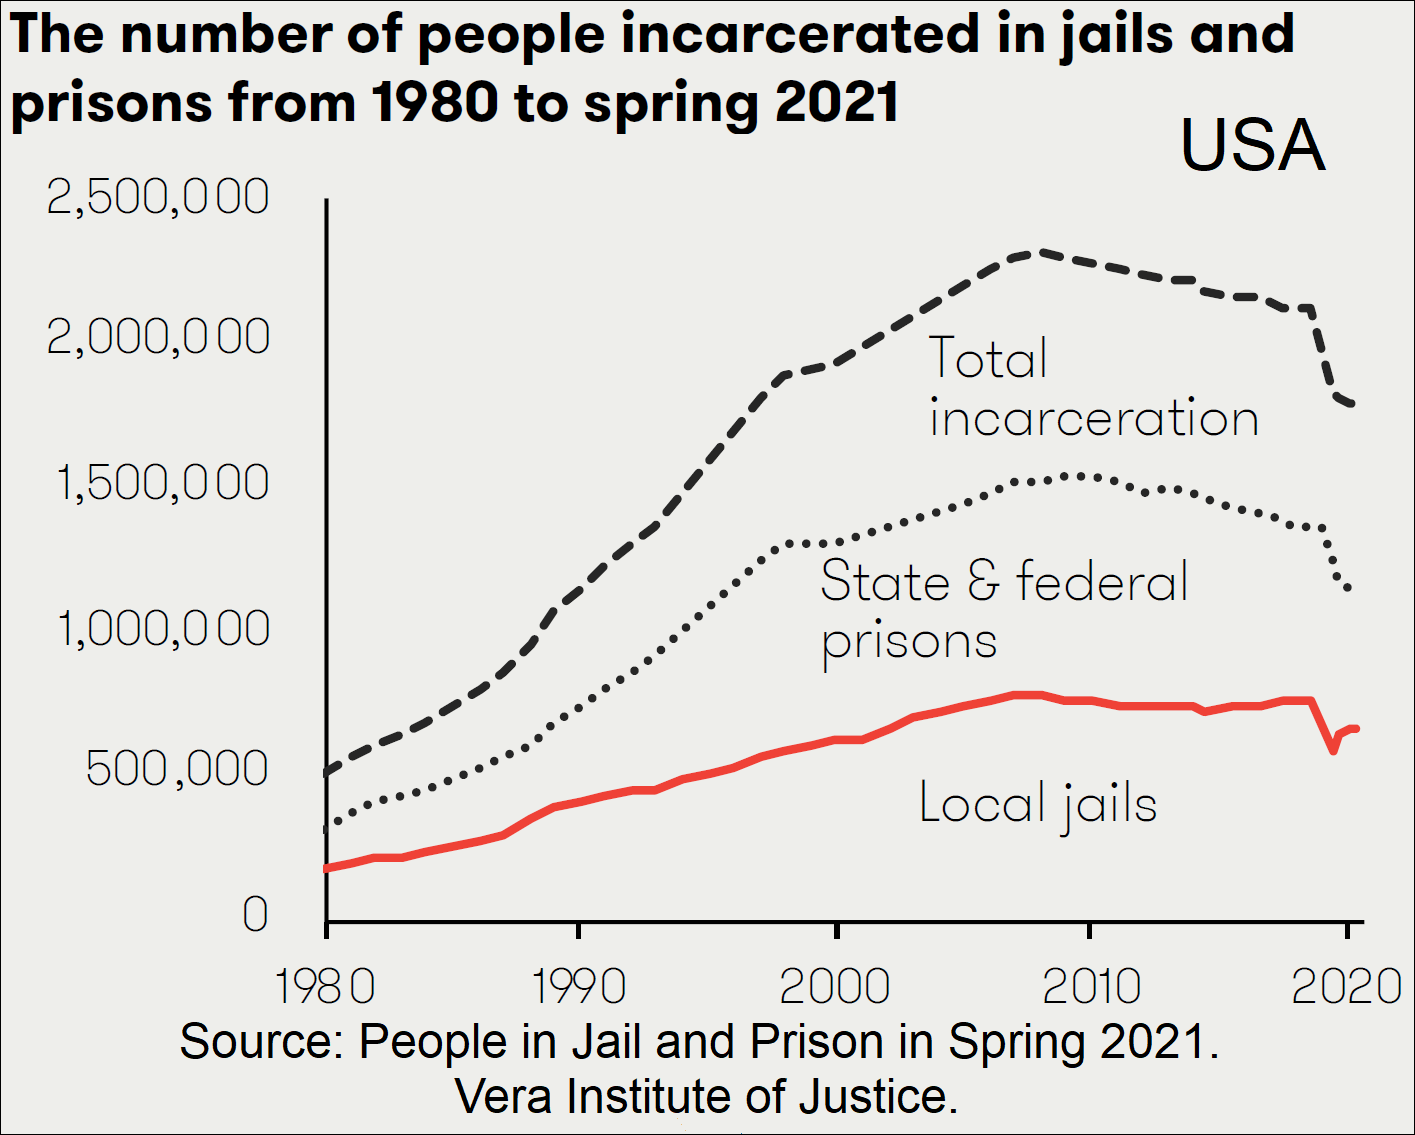
US timeline graphs of number of people incarcerated in jails and prisons.
|
| Date | - date of first upload to the Commons. See file history for date of latest upload. |
| Source | https://www.vera.org/downloads/publications/people-in-jail-and-prison-in-spring-2021.pdf |
| Author | Jacob Kang-Brown, Chase Montagnet, and Jasmine Heiss. People in Jail and Prison in Spring 2021 . New York: Vera Institute of Justice , 2021. |
Licensing
|
|
This chart is
ineligible for
copyright
and therefore in the
public domain
, because it consists entirely of information that is common property and contains no original authorship. For more information, see
Commons:Threshold of originality § Charts
|